
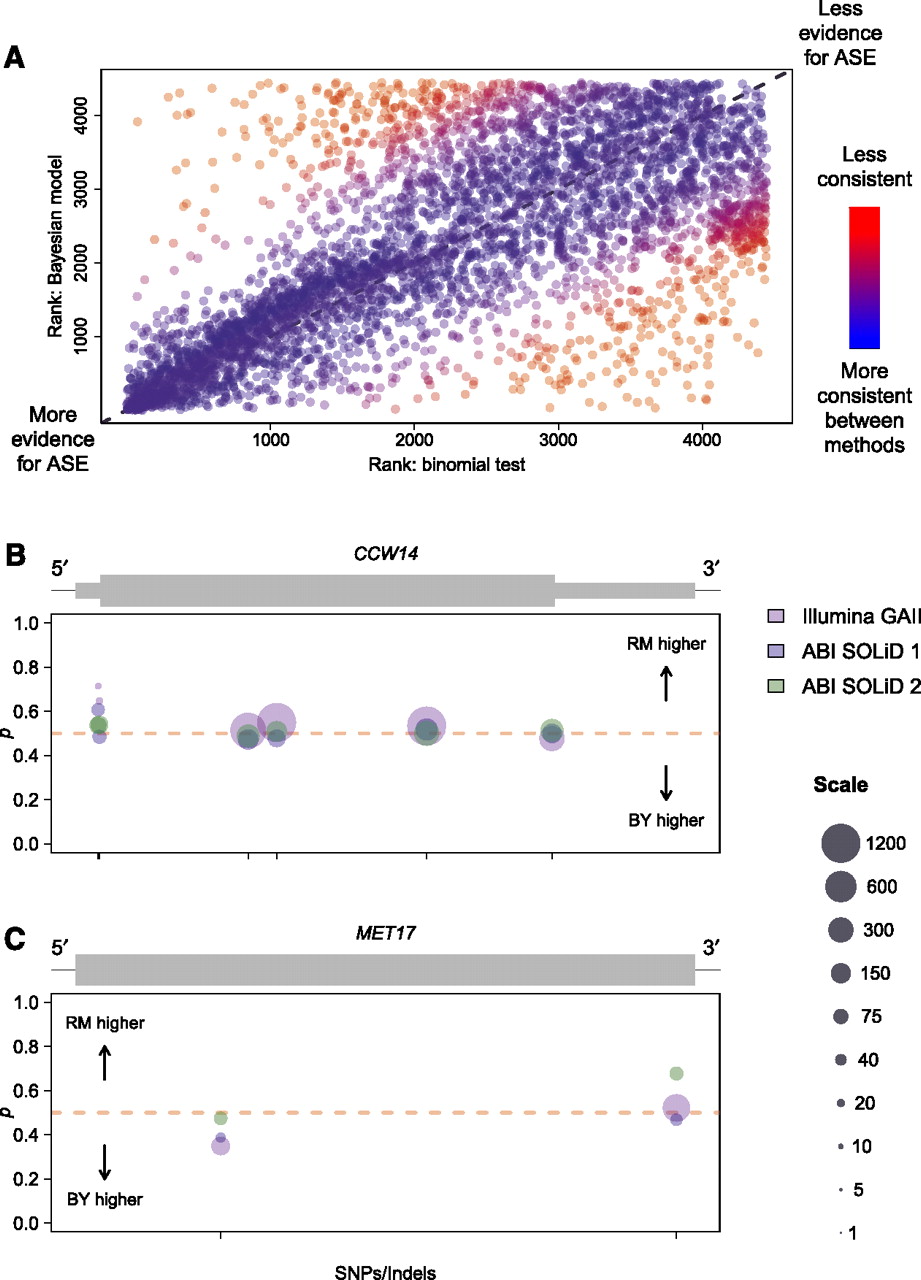
Comparison of results from the binomial test and Bayesian model of ASE. (A) Plot comparing ranks of genes in terms of evidence for ASE for the binomial test versus the Bayesian model. Ranks were determined using P-values for the binomial test and using posterior probabilities of ASE for the Bayesian model. Ties were broken by random assignment of ranks to genes with equal P-values/posterior probabilities of ASE. Points are colored according to consistency of ranks between methods. As shown in the color bar to the right, redder points represent genes with ranks that are less consistent between methods, while bluer points show genes ranked more consistently between methods. Dotted gray line in background follows y = x. (B) Allele-specific read counts for the gene CCW14, which is called as showing ASE using the binomial test, but not with the Bayesian model. Plot depicts the gene model (gray rectangles), with thick rectangles representing exons, thinner rectangles representing 5′ and 3′ UTRs, and the thin black line representing intergenic sequence. Circles plotted below the gene model show allele-specific read count data organized by SNPs/indels within the gene. Circles are centered on the point p = (BY count)/(BY count + RM count), and sized according to the total number of reads contributing to the observation. Scaling of circle size follows the scale given on the far right, with all observations with more than 1200 reads set to the largest size shown (1200). Circle colors indicate which experiment the observation is derived from, as shown in the legend on the far right. Ticks on the x-axis indicate the location of SNPs or indels used to distinguish between alleles. Sequence coverage is high, and the slight departures from 50:50 allelic expression are likely due to technical variability rather than some underlying biological mechanism. (C) Allele-specific read counts for the gene MET17, which is called as showing ASE using the Bayesian model, but not with the binomial test. Plot is organized and colored identically to B. The data show a modest but reproducible change in ASE from read counts higher for the BY allele to read counts higher for the RM allele moving 5′ to 3′.


