
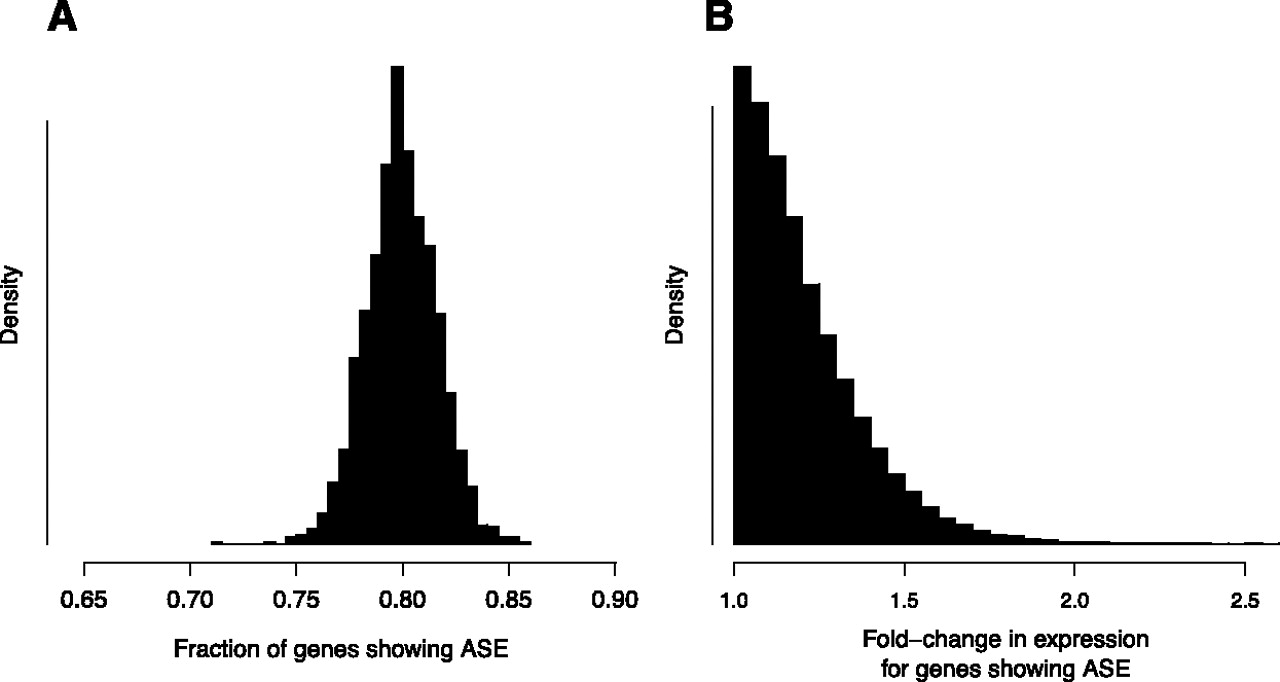
Global features of ASE in the yeast genome. (A) Posterior distribution of the fraction of genes showing ASE, 1 − π0. (B) Posterior distribution for the size of the fold-change in expression of genes showing ASE. Fold-change values are shown relative to the allele expressed at a lower level, meaning that all values are greater than one. Distribution depicts the estimated probability density from which the magnitude of the ASE would be drawn for a new gene known to show ASE. Distribution shown was simulated by randomly drawing values from beta distributions specified by posterior samples of f and g, which determine the shape of the probability density of the binomial parameter p for genes showing ASE.


