
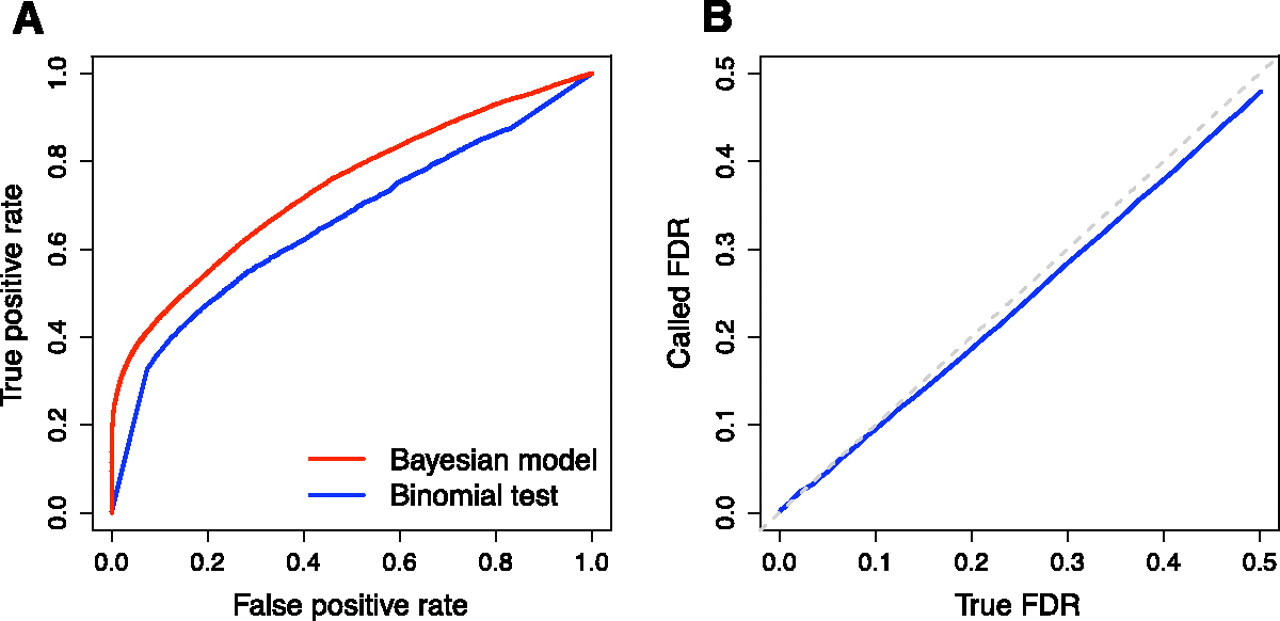
Performance of the Bayesian model for ASE. (A) Receiver operating characteristic (ROC) curve showing the performance of our model compared to the binomial exact test. Read counts were tabulated on simulated data with overdispersion, as described in the Supplemental Methods. The ROC curve plots the number of true positives called correctly and the number of false positives called incorrectly using P-value thresholds from 0–1 for the binomial test and posterior probabilities of no ASE from 0–1 for our Bayesian model. (B) Observed FDR closely tracks the true FDR. Observed and true FDRs were calculated for simulated data with overdispersion, as described in the Supplemental Methods. The dotted light gray line shows y = x.


