
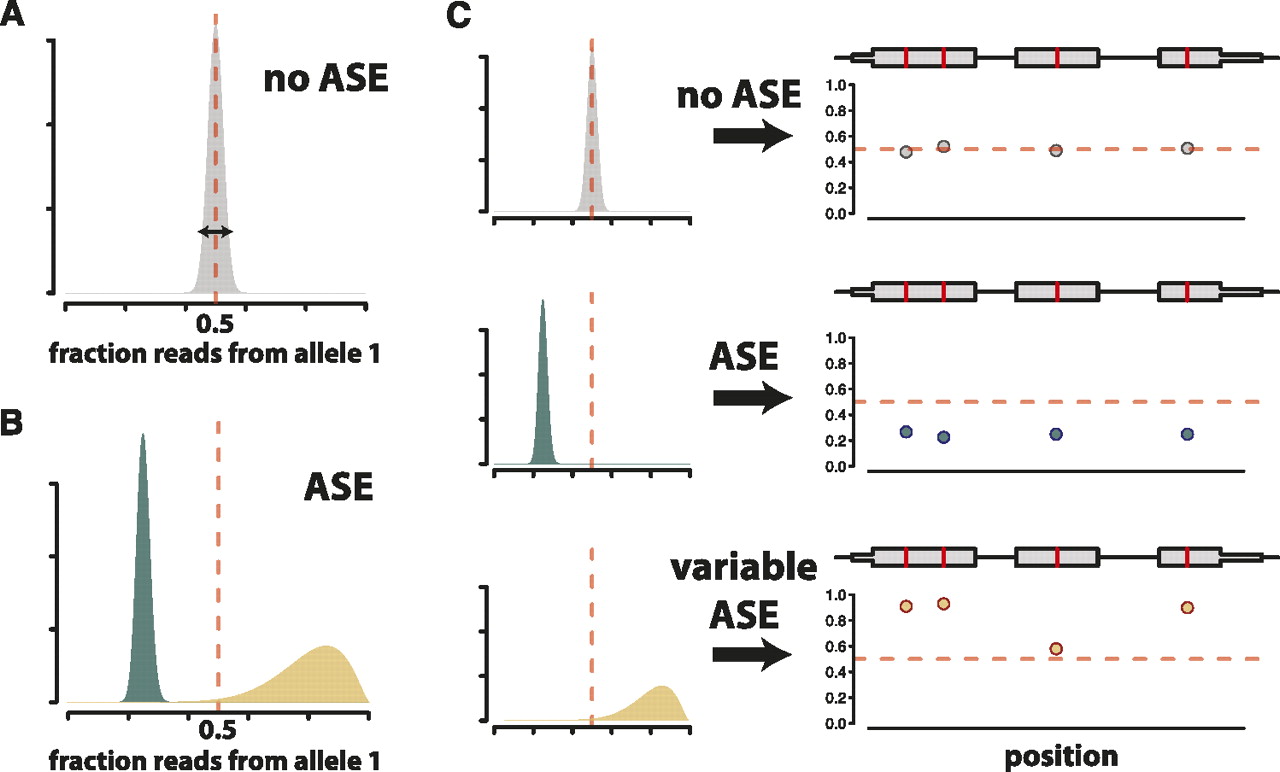
Schematic outline of our model. (A) The true fraction of reads from allele one should be exactly 0.5 in genomic DNA from a diploid. We use genomic DNA sequencing to calibrate our model in order to account for noise in read counts (arrow depicting width of distribution) at all SNPs as a result of technical variability inherent in the sequencing process. (B) Genes are partitioned into two categories: genes with ASE and those without ASE. For genes without ASE, the distribution of the fraction of reads from allele one is estimated as in A. We borrow information from across all genes to estimate the mean and variability of the corresponding distributions for genes with ASE, the second category. Some genes in this category have a mean different from 0.5 but low dispersion in read counts, like genes without ASE (blue distributions). Other genes in this category have greater dispersion in read counts (tan distributions). (C) Distributions for the fraction of reads from allele one are estimated for each gene. Differences in mean and variability of these gene-specific distributions allow for genes that do not show ASE (top), genes that show ASE that is constant across the transcript (middle), and genes that potentially show complex patterns of ASE (variable ASE), such as allele-specific alternative splicing (bottom). (Left panels) Gene-specific distributions of the fraction of reads from allele one. (Right panels) Simulated allele-specific read counts for a three-exon gene (gray boxes) containing four SNPs (red lines). Dots below the gene model indicate, at each SNP, the fraction of reads matching allele one.


