
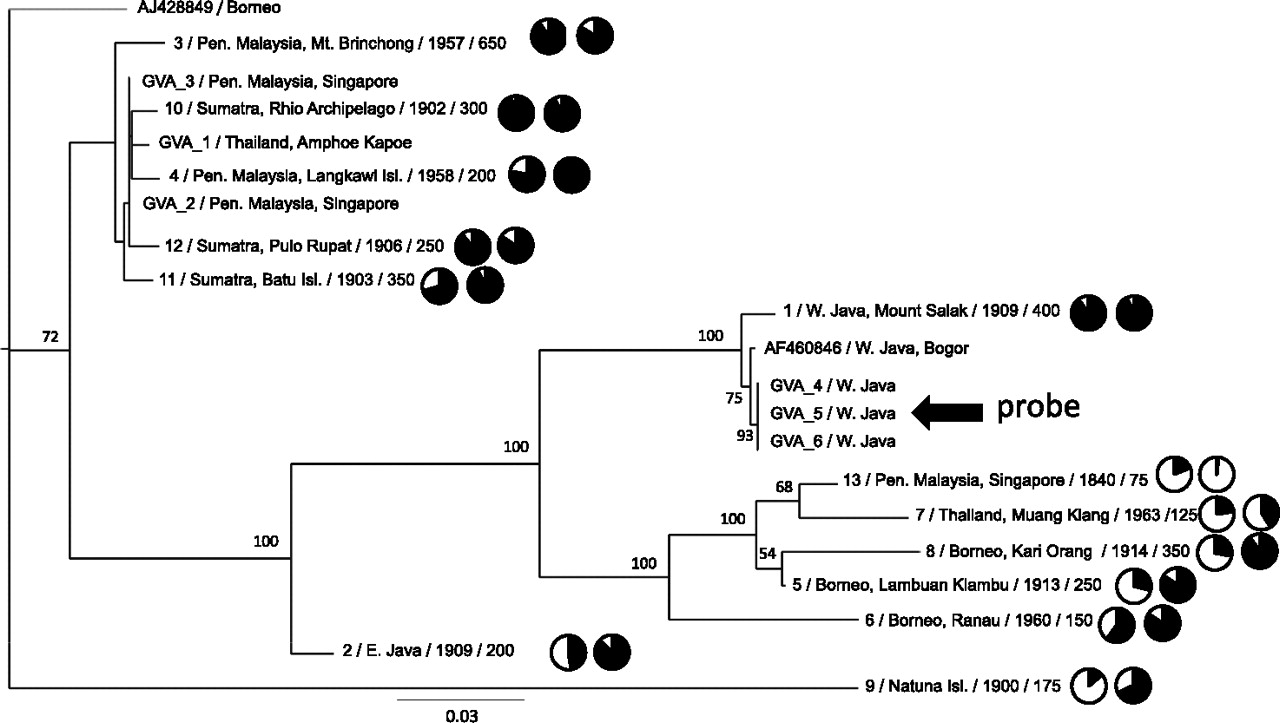
Maximum likelihood phylogenetic tree of Sunda colugo mtDNA sequences and the effect of phylogenetic divergence on capture efficiency and genome coverage. Specimens are labeled with geographic location of specimen collection and their USNM catalog number, Texas A&M sample number (prefix “GVA”), or GenBank accession number. Additional sample information following the taxon ID includes (left to right): average starting DNA fragment size distribution (in base pairs), a pie chart showing percent genome coverage, and a pie chart showing selection efficiency. Bootstrap values displayed at each node are based on 1000 replicates. The tree shown is based on those sites where 50% of the individuals possess a base (14,008 bp, excluding hypervariable regions) (see Methods) at a minimum depth of 5×. The overall relationships were supported in other analyses that minimized missing data and maximized data overlap across individuals (Supplemental Fig. 4). The tree is displayed with midpoint rooting. The specimen (GVA4) from whom the mtDNA probe was derived is indicated with an arrow.


