
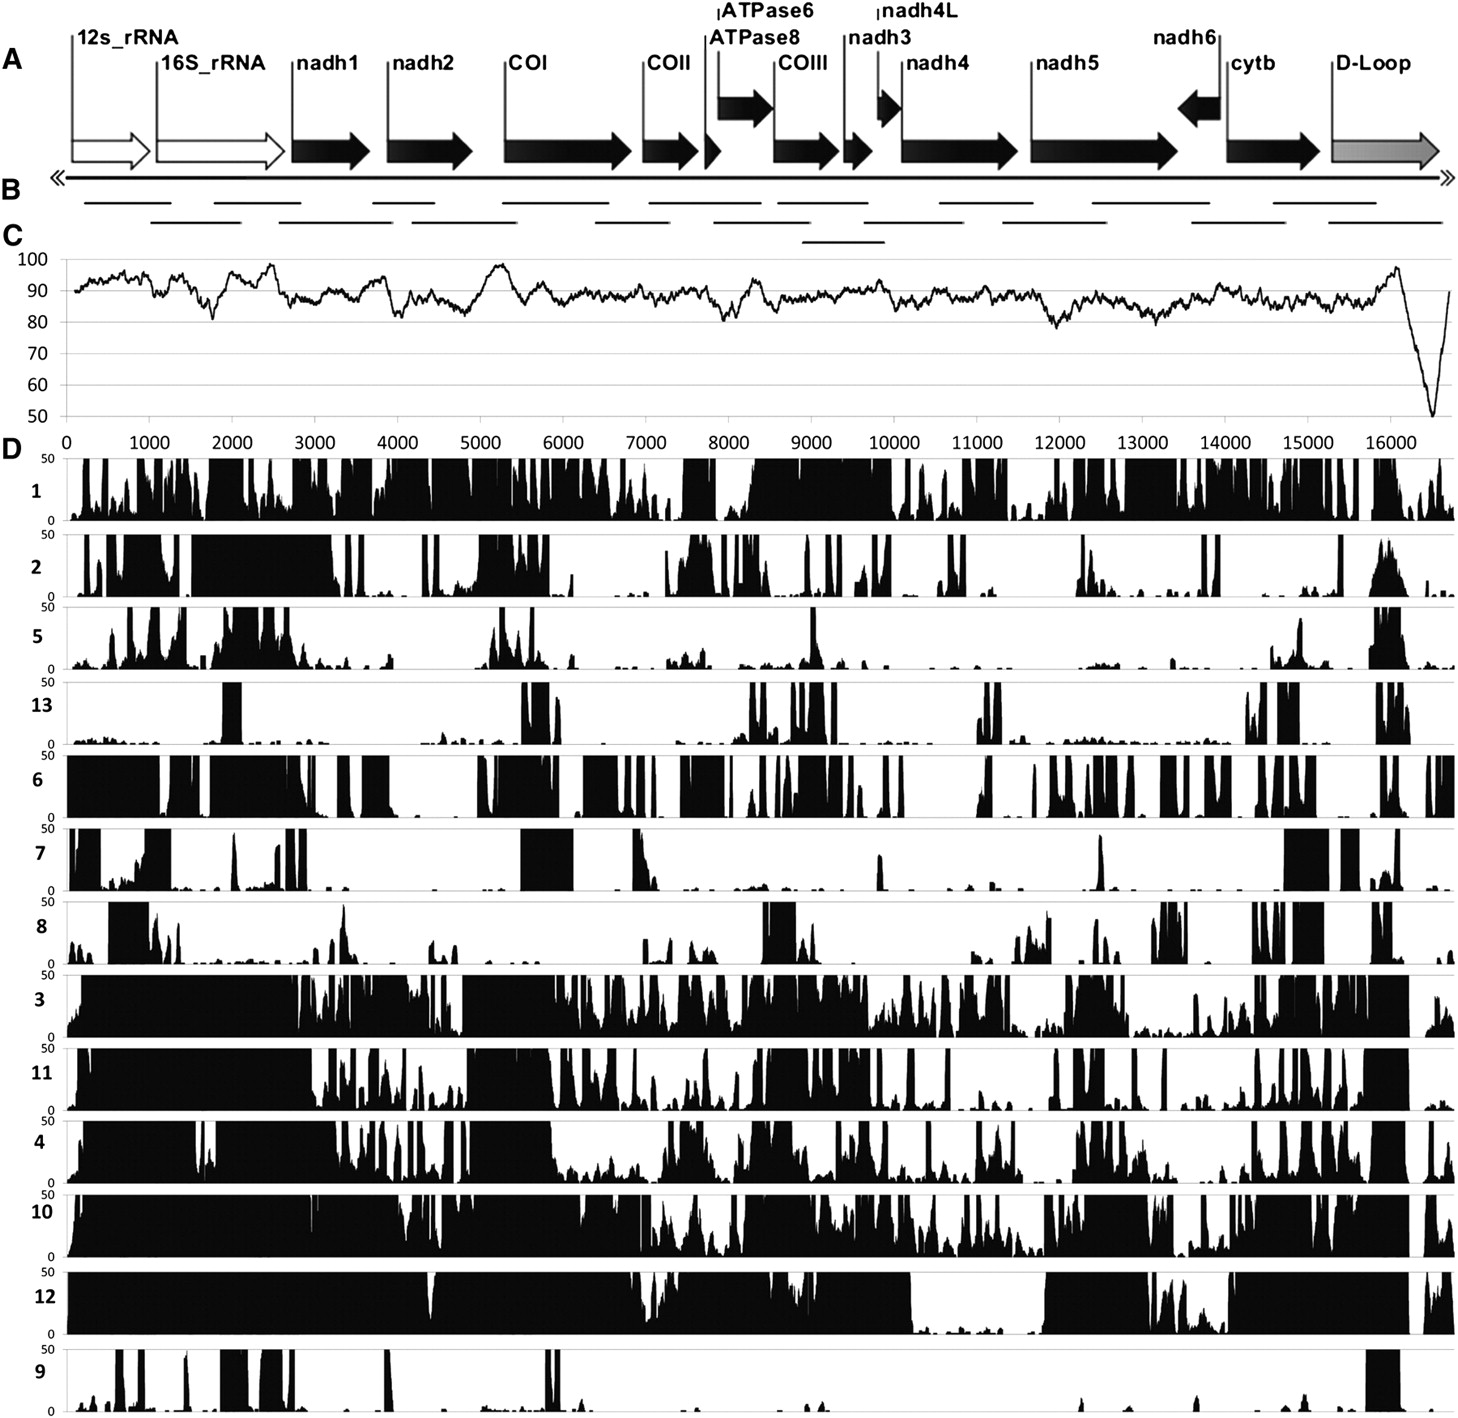
Distribution and depth of coverage of captured mtDNA fragments from each Sunda colugo museum specimen, displayed relative to the reference colugo mtDNA genome. (A) Reference colugo genome, AJ428849, depicted horizontally with gene annotations displayed except tRNA genes. (B) Distribution of mtDNA probe fragments produced by PCR. (C) Plot of DNA sequence identity between two full-length mitochondrial reference genomes (AJ428849, Borneo; AF460846, West Java) calculated in overlapping, 200-bp sliding windows. (D) Histogram showing distribution of captured mtDNA sequence fragments for the 13 museum specimens (labeled on left side by ID number in Table 1), relative to the reference genome. Only coverage from 0× to 50× is shown for clarity, although most individuals have substantially higher coverage across the genome (Supplemental Fig. 6).


