
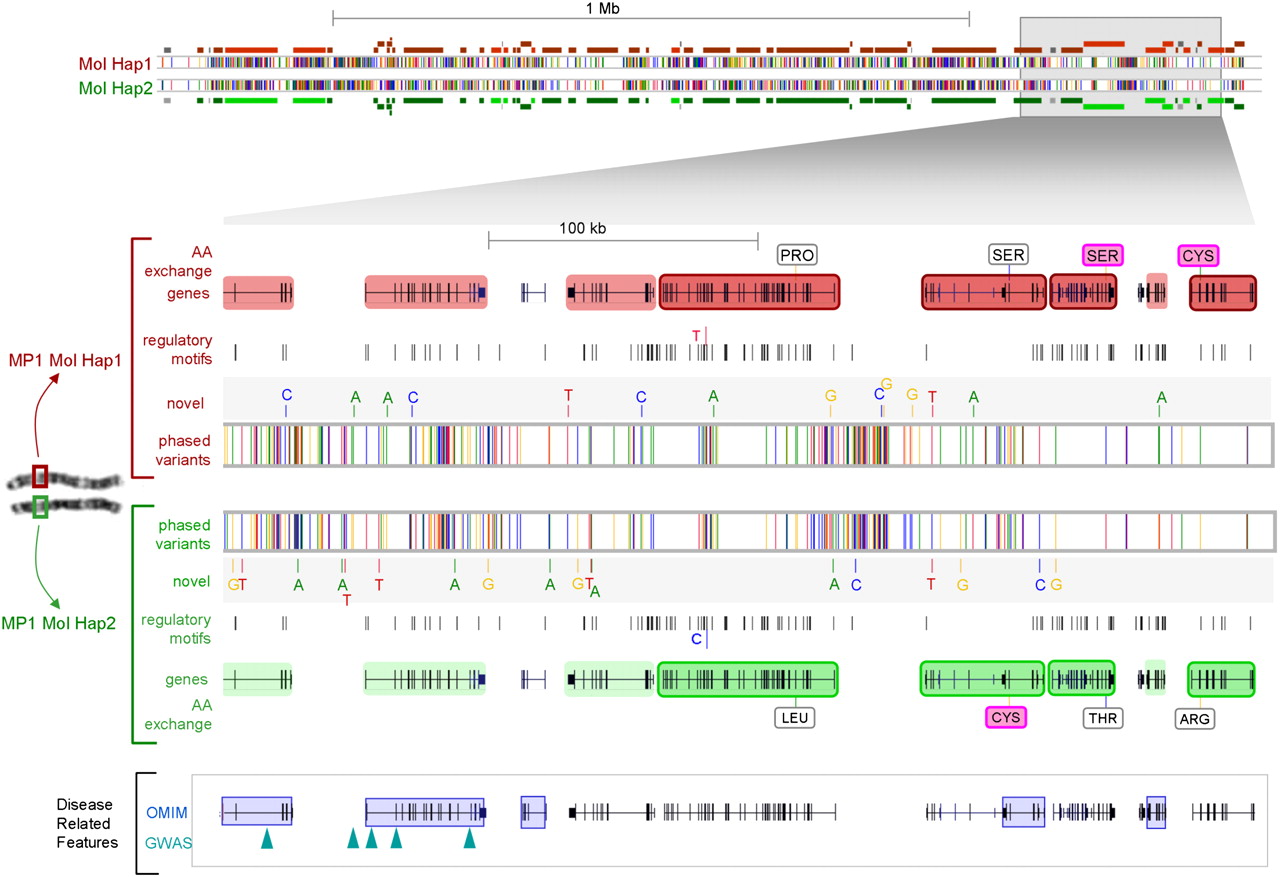
Example of a 1.7-Mb haploid landscape of functional variation on chr. 19. Both molecular haplotypes are shown. Differences between the two are shown at the nucleotide level with bases in yellow = G, red = T, green = A, and blue = C, within framed bars (centered). Novel SNPs are assigned to each of the two haplotypes. Regulatory motifs (TFBSs track) differ in one SNP. At the level of genome organization, genes that have two different molecular haplotypes are shaded red or green per haplotype, and those encoding two differing proteins are highlighted and framed. Nonsynonymous mutations on each haplotype are annotated (damaging AA exchanges [Adzhubei et al. 2010] in pink). Disease-related features (GWAS and OMIM) are shown in lower track.


