
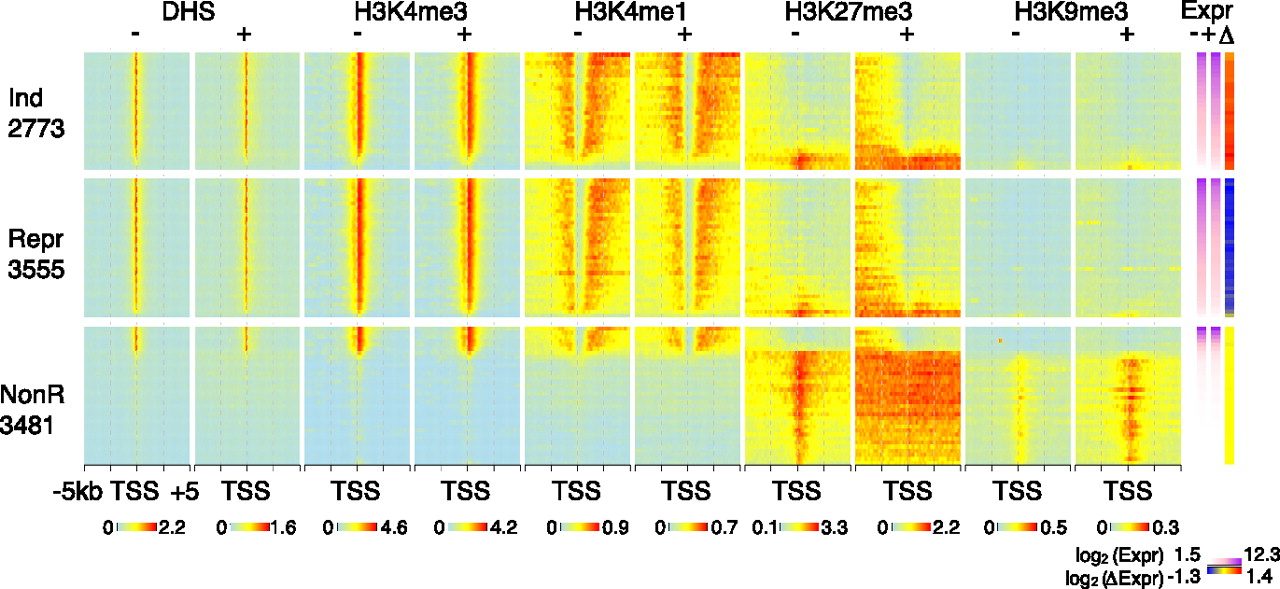
Relationship between levels of epigenetic features around the TSS and expression. Heatmaps showing the distribution of DNase hypersensitivity and the four histone modifications in 10-bp windows through a 10-kb DNA segment centered on the TSS for both G1E and G1E-ER4+E2 cells. Genes in the three response categories (Ind indicates induced; Repr, repressed; NonR, nonresponsive; numbers of genes are given below the category name) were ranked by their expression levels in G1E cells and then placed into groups of 100 genes. In each group, the normalized log2 ChIP-seq counts in the windows at the same position relative to the TSS were aggregated by taking their mean. The expression levels and changes in expression level (average for each group of 100 genes) are shown as heatmaps on the right side.


