
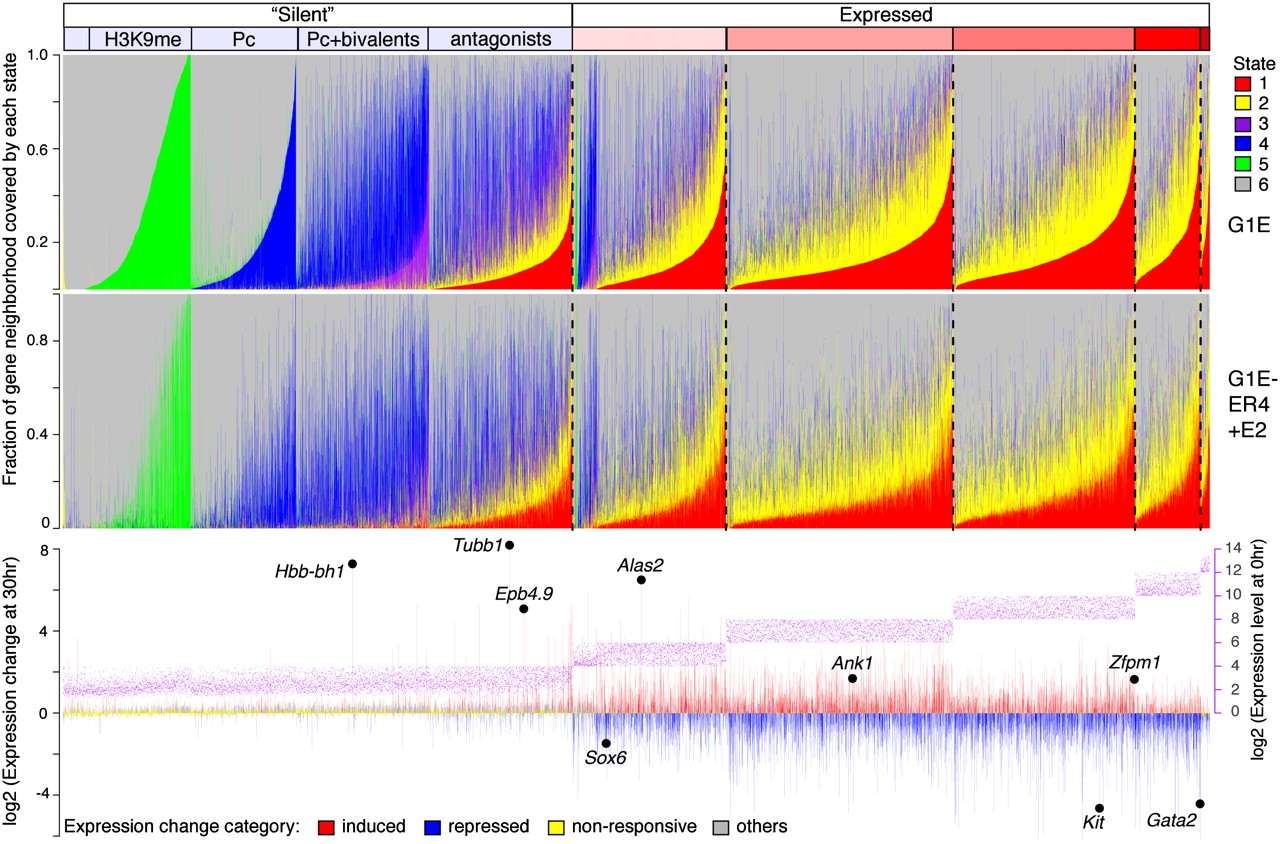
Coverage of gene neighborhoods by chromatin states. The fraction of each gene neighborhood covered by each chromatin state (red for the H3K4me1,3-dominated state 1, yellow for the H3K4me1-dominated state 2, purple for the H3K4me1,K27me3-dominated state 3, blue for the H3K27me3-dominated state 4, green for the H3K9me3-dominated state 5, and gray for the low signal state 6) is graphed for G1E cells (top panel) and G1E-ER4+E2 cells (middle panel). For each gene, the expression level is shown as a purple dot, and the change in expression during differentiation is shown as a bar in the third panel (red for induced, blue for repressed, yellow for no change, and gray for other). The gene neighborhoods are partitioned by their level of expression into bins covering two log2 expression levels, except the first bin, which includes all levels less than log2 of 4. Within each expression bin, the genes are ordered first by coverage by state 1 and then by coverage by state 3, state 4, state 5, and state 6.


