
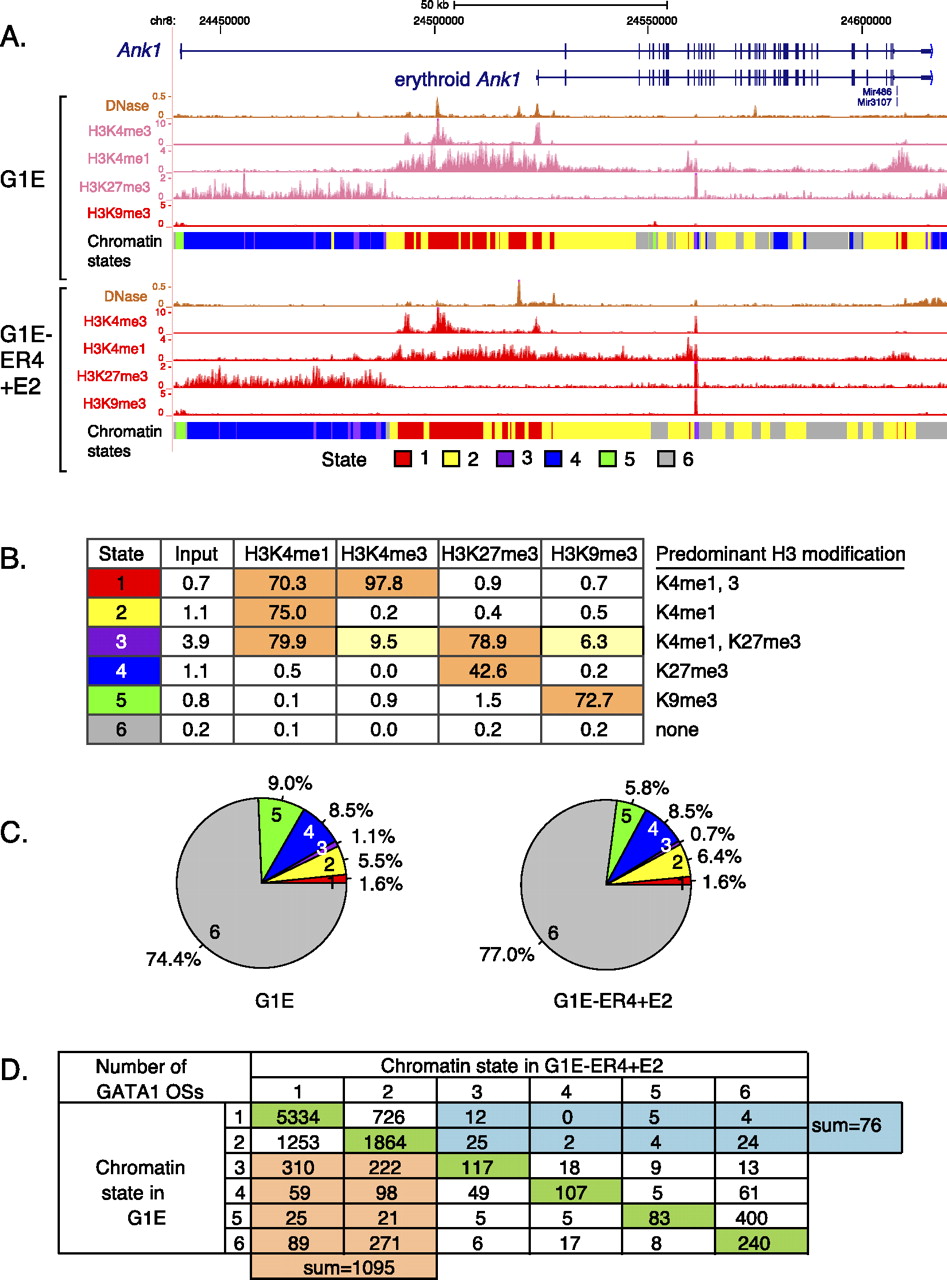
Segmentation of the mouse erythroid genome based on chromatin modifications. (A) Patterns of histone modifications around the Ank1 gene, showing repression of a nonerythroid promoter by the Polycomb mark H3K27me3 and presence of the erythroid promoter in a state enriched in the trithorax marks H3K4me3 and H3K4me1. (B) The six chromatin states emitted by the model computed by the segmentation program; the emission spectrum for the four modifications and the “input” DNA is listed in the matrix. (C) The proportion of each state on the genome in the two cell lines. (D) Changes in chromatin state between G1E and G1E-ER4+E2 cells for DNA segments occupied by GATA1 in the latter cells. Each GATA1 occupied segment was assigned to the predominant chromatin state in each cell line. The numbers of GATA1 occupied segments that do not change chromatin state are shown in the green cells, those that shift from an active state (state 1 or 2) to an inactive state (state 3–6) are in teal, and those that shift from inactive to active are in orange.


