
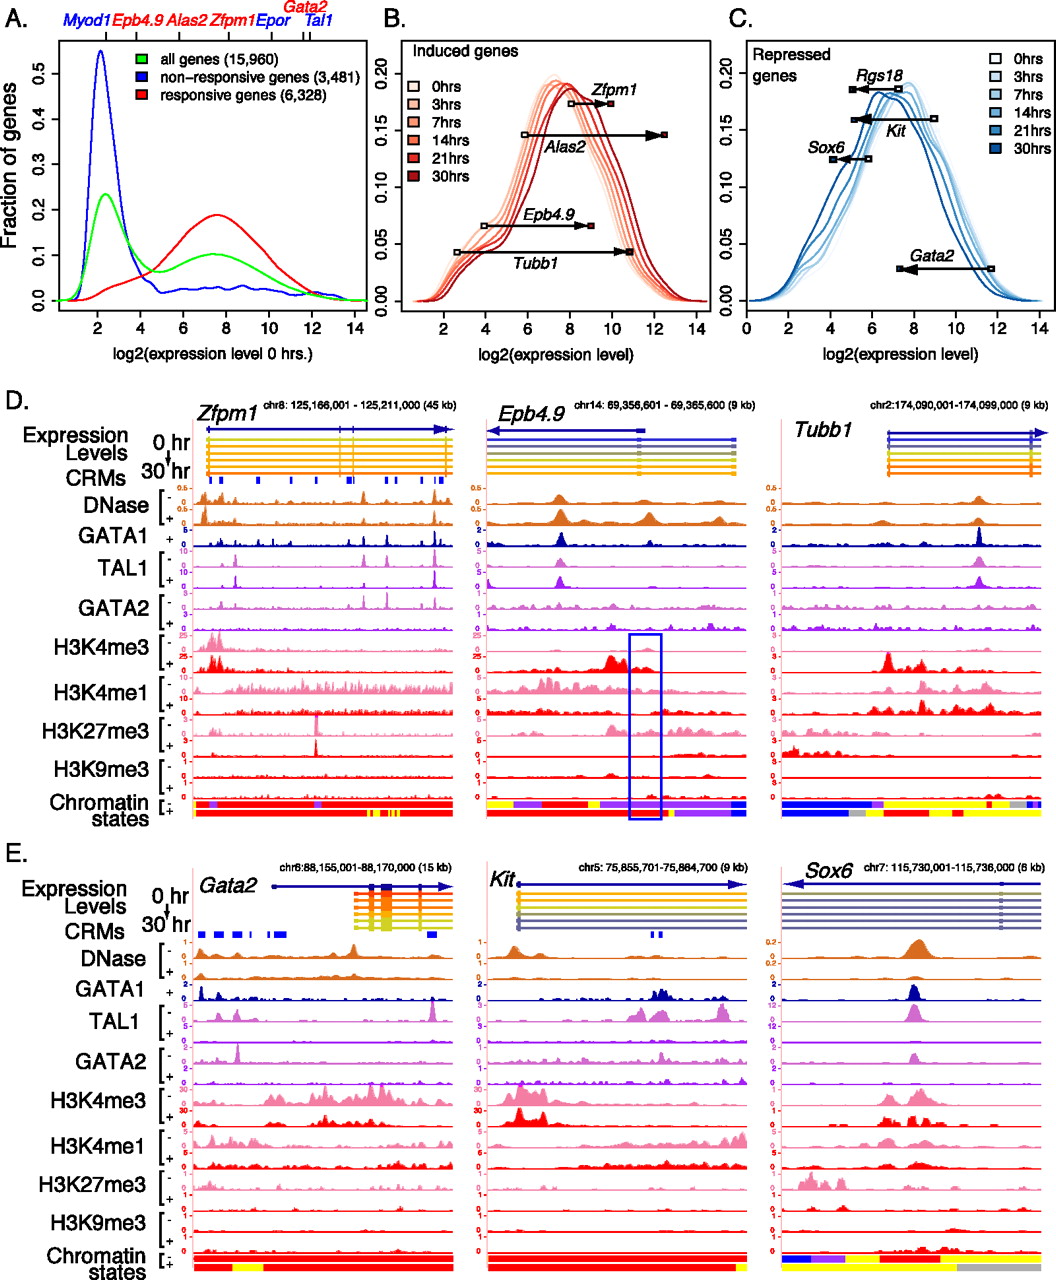
Distributions of expression and response of erythroid genes. (A) Distributions of numbers of genes, binned by their initial expression level prior to activation of GATA1-ER. (B,C) Distribution of numbers of induced genes (B) and repressed genes (C) by expression levels, over the time course of differentiation after activation of GATA1-ER. (D,E) Epigenetic features around examples of induced and repressed genes, respectively. Each panel shows the gene (or portion thereof), a color representation of the expression level (low to high is blue to red), erythroid CRMs where known, and signal tracks for the sequence census data on transcription factor occupancy, DNase HSs, and histone modifications. Other conventions are the same as in Figure 1.


