
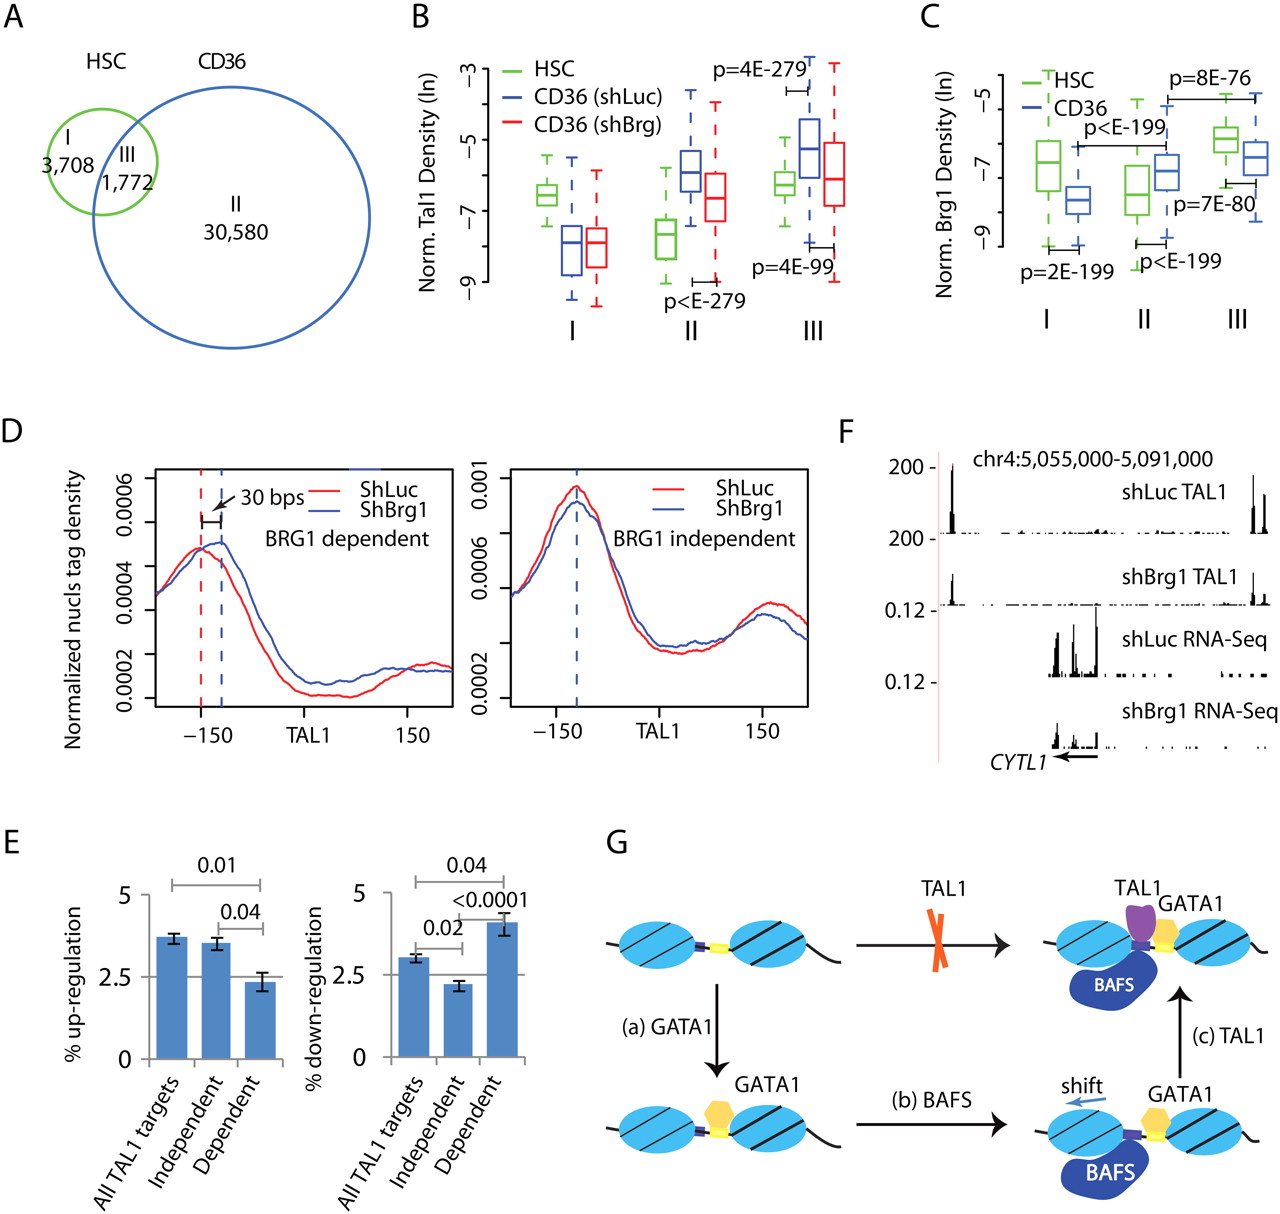
BRG1-induced nucleosome shifting facilitates binding of TAL1. (A) Venn diagram comparison of TAL1 binding sites in HSCs and CD36+ cells. (B) Box-plots for the normalized TAL1 tag density for the three groups of TAL1 sites as specified in A in three cell types (HSCs, BRG1 knockdown CD36+, and control CD36+ cells). (C) Box-plots for the normalized BRG1 density in HSCs and the CD36+ cells for the three groups of TAL1 binding sites as specified in A. (D) Nucleosome profiles in BRG1 knockdown and control cells for the regions centered on the 6046 BRG1-dependent (left panel) or 1665 BRG1-independent TAL1 sites (right panel). See main text for the definition of “BRG1-independent” and “BRG1-dependent” TAL1 binding sites. (E) Percentages of up-regulation and down-regulation among the genes that contain TAL1 binding sites in the region within ±20 kb of the TSSs. Three groups of genes are shown: All TAL1 target genes (6905); Dependent (1542) indicates the group of genes to which TAL1 binding at all associated TAL1 sites was compromised by BRG1 knockdown; and Independent (3302) indicates the groups of genes to which TAL1 binding at none of the associated TAL1 sites was affected by BRG1 knockdown. The standard deviations are calculated by bootstrapping. P-values are calculated by χ2 test. (F) UCSC Genome Browser images showing that the decreased binding of TAL1 is associated with decreased transcription of the CYTL1 gene measured by RNA-seq. The y-axis of RNA-seq tracks is normalized as number of tags per base pair sequence per million tags. (G) A model for the sequential activity of GATA1 binding, recruitment of BRG1, and nucleosome shifting, and binding of TAL1 to the hematopoietic enhancer regions.


