
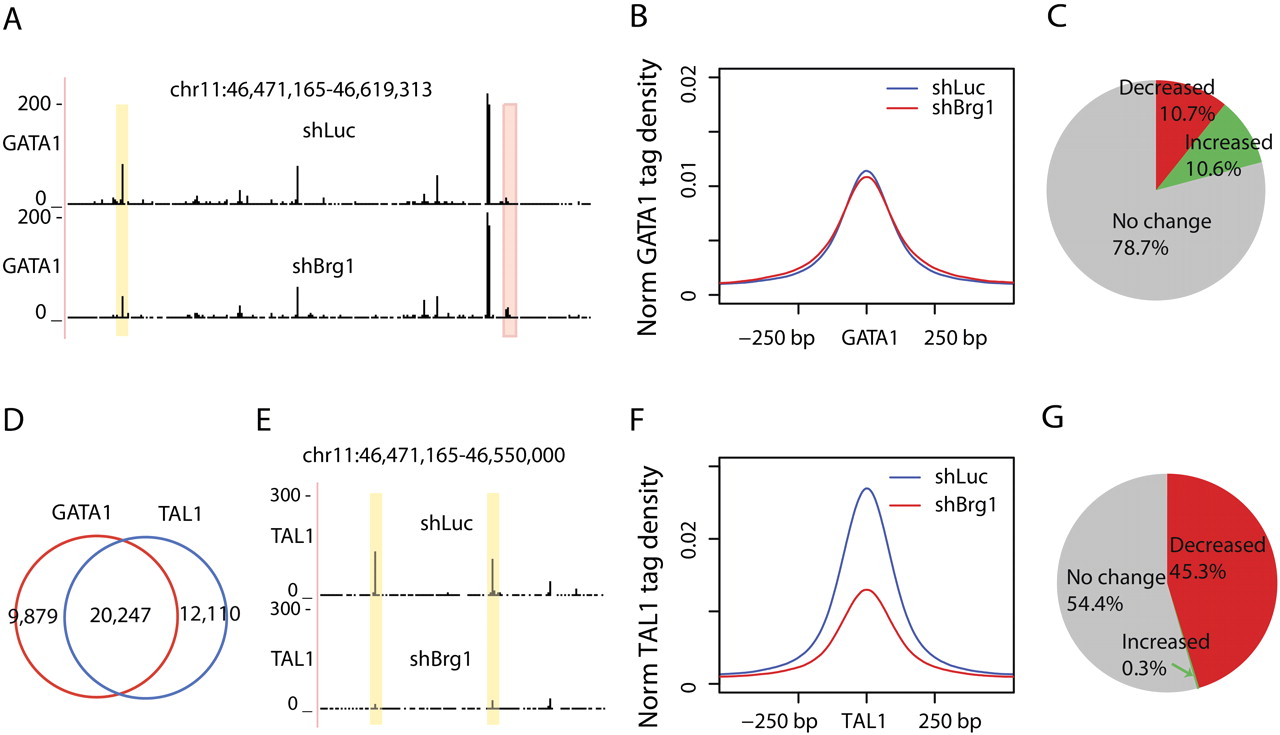
BRG1 knockdown decreases binding of TAL1 but not GATA1. (A) UCSC Genome Browser images of GATA1 binding in the BRG1 knockdown and control cells. Genomic regions with significantly increased and decreased levels of GATA1 binding (P-value < 0.00001; FC > 1.5) are highlighted in pink and yellow, respectively. (B) GATA1 tag densities around the GATA1 sites in the BRG1 knockdown and control cells. The tag density profiles of 39,702 GATA1-enriched regions are plotted for the control and knockdown cells. (C) The percentage of GATA1 binding sites that showed an increase, decrease, or no change in GATA1 binding in the BRG1 knockdown cells. (D) GATA1 and TAL1 are extensively colocalized in CD36+ cells. (E) UCSC Genome Browser images showing that TAL1 binding was compromised in the BRG1 knockdown cells. Genomic regions with a significant decrease in TAL1 binding (P-value < 0.00001; FC > 1.5) are highlighted in yellow. (F) TAL1 tag densities at the TAL1 sites in the BRG1 knockdown and control cells. The tag density profiles of 34,620 TAL1-enriched regions are plotted for the control and knockdown cells. (G) The percentage of TAL1 binding sites that showed an increase, decrease, or no change in TAL1 binding in the BRG1 knockdown cells.


