
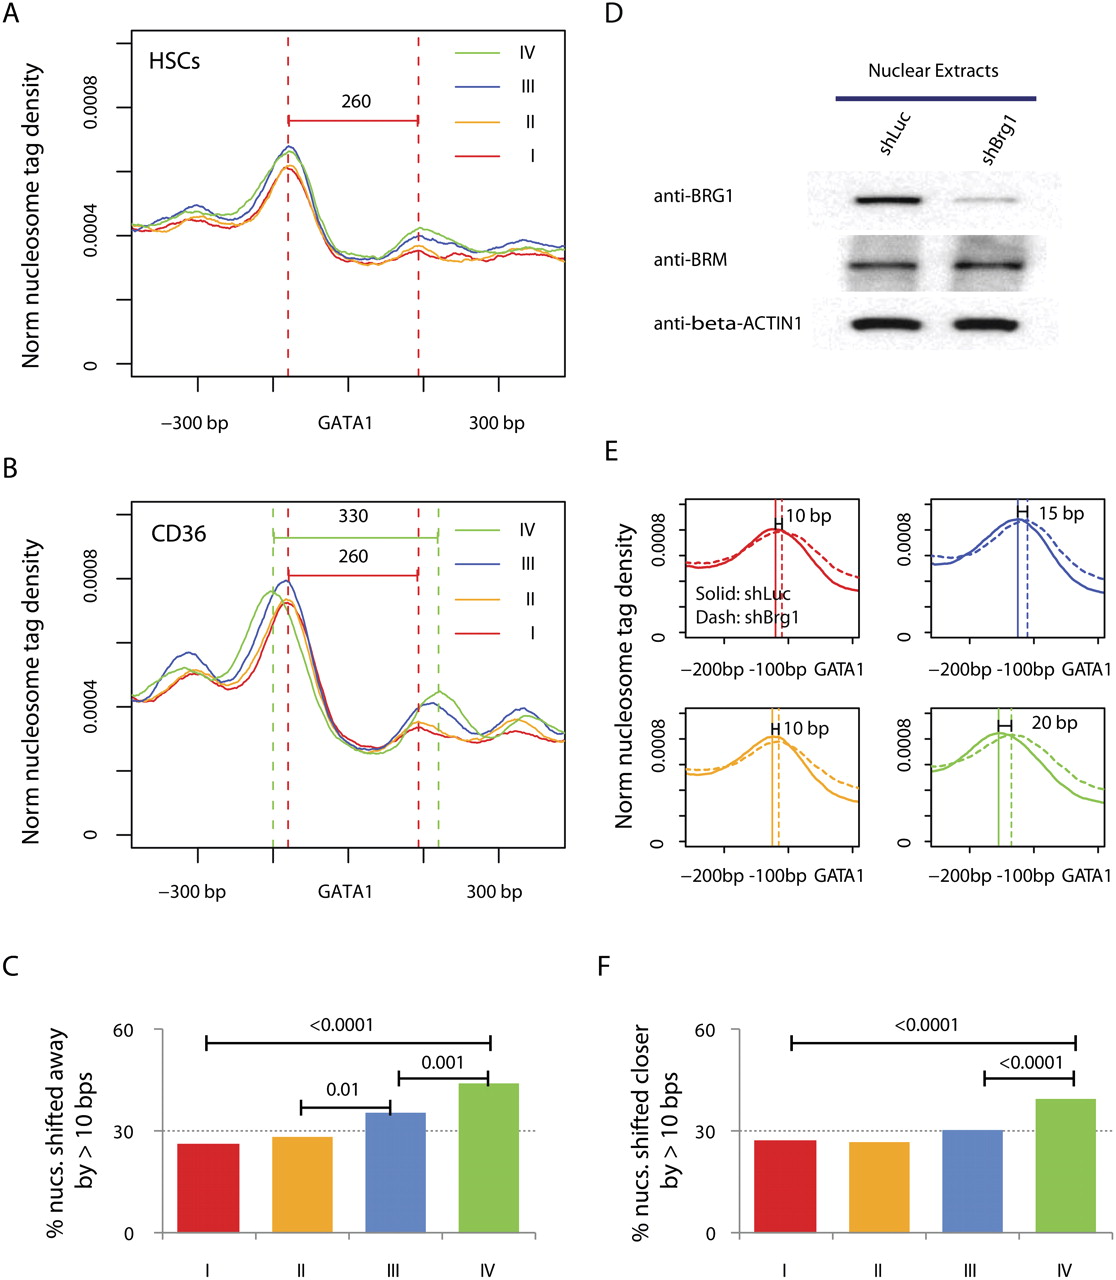
BRG1 mediates nucleosome shifting surrounding the GATA1 sites. (A) Nucleosome profiles in HSCs surrounding the distal GATA1 binding sites that are identified in CD36+ cells. The sites are grouped into four quartiles according to the level of BRG1 binding in CD36+ cells (I to IV denote low to high; 5951 sites per group). The profiles are organized such that the nearest nucleosome is in the upstream of the GATA1 site. Only sites that are predicted at linker regions in both cells are included. (B) Nucleosome profiles in CD36+ cells surrounding the same sites as in A. (C) The percentage of GATA1 binding sites exhibiting a nucleosome shift of >10 bp away from the sites during differentiation of HSCs. The GATA1 sites, which are located at linker regions and have nucleosomes within ±200 bp in both the HSCs and CD36+ cells, are sorted into equal-sized groups (∼600 per group) based on the BRG1 binding levels in the CD36+ cells; I to IV denote the lowest to the highest. P-values are calculated by χ2 test. (D) BRG1 was efficiently knocked down, as shown by the Western blotting analysis of nuclear extracts from the CD36+ cell expressing a small hairpin RNA targeting BRG1 (shBrg1) or the luciferase gene (shLuc) with antibodies indicated on the left. (E) Nucleosome profiles in BRG1 knockdown (dashed lines) and control cells (solid lines) for the region upstream of GATA1 binding sites, which are grouped as in A. (F) The percentage of GATA1 binding sites exhibiting a nucleosome shift of >10 bp toward the sites after knocking down of BRG1 in the CD36+ cells. The GATA1 sites, which are located at linker regions and have nucleosomes within ±200 bp in both the HSCs and CD36+ cells, are sorted into equal-sized groups (∼700 per group) based on the BRG1 binding levels in the CD36+ cells; I to IV denote the lowest to the highest.


