
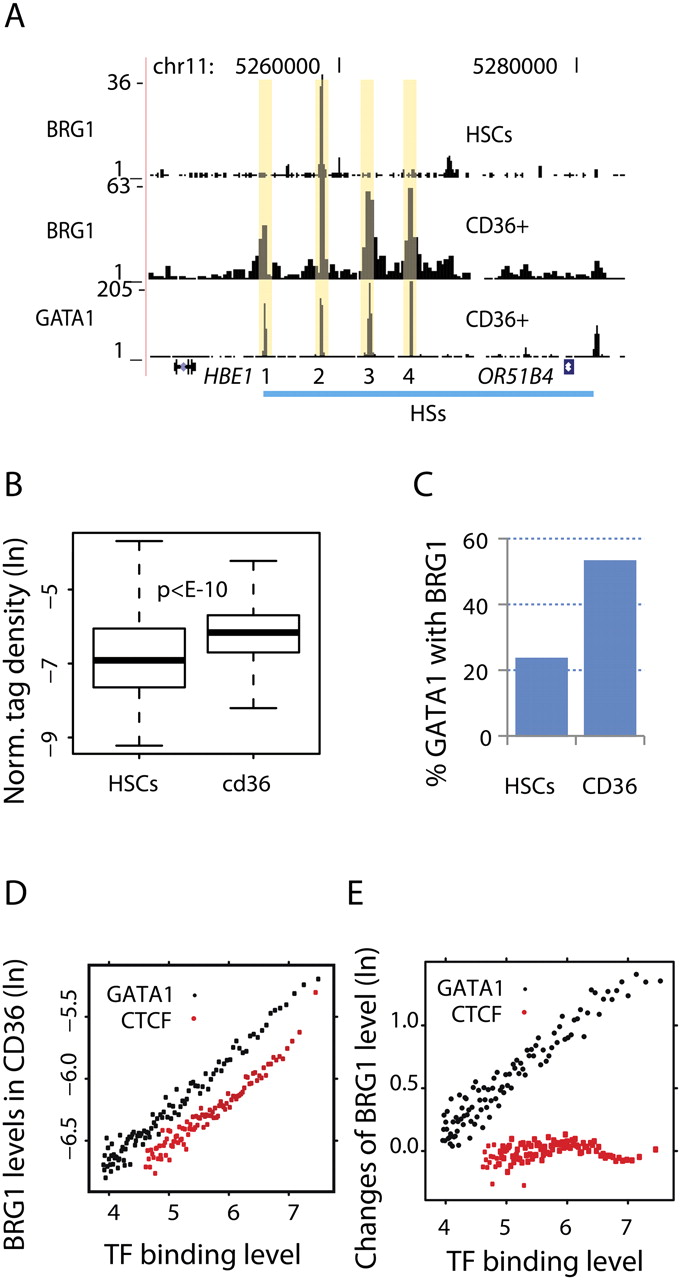
GATA1 binding is positively correlated with BRG1 binding during differentiation of HSCs. (A) UCSC Genome Browser images showing the colocalization of BRG1 with GATA1 in CD36+ cells. The four DNase I hypersensitive sites (HS) bound by GATA1 in the LCR of the beta-globin domain are indicated at the bottom. (B) Box-plots of BRG1 density at the 24,491 distal GATA1-bound region in HSCs and CD36+ cells. (C) Percentage of GATA1 binding sites that are also bound by BRG1 in HSCs and CD36+ cells. (D) Correlation between GATA1 (black dots) and CTCF (red dots) binding levels with that of BRG1 binding in CD36+ cells. The 30,126 GATA1 or 40,392 CTCF binding sites are binned into groups with equal size of 200 based on the TF binding levels. The densities of BRG1 sequence tags (ln) and the TF tag enrichment scores (ln) from MACS are then averaged for each group. (E) Correlation between the changes in BRG1 binding from HSCs to CD36+ cells at GATA1- or CTCF-bound regions with the levels of GATA1 or CTCF binding in CD36+ cells. The TF binding sites are binned as in D.


