
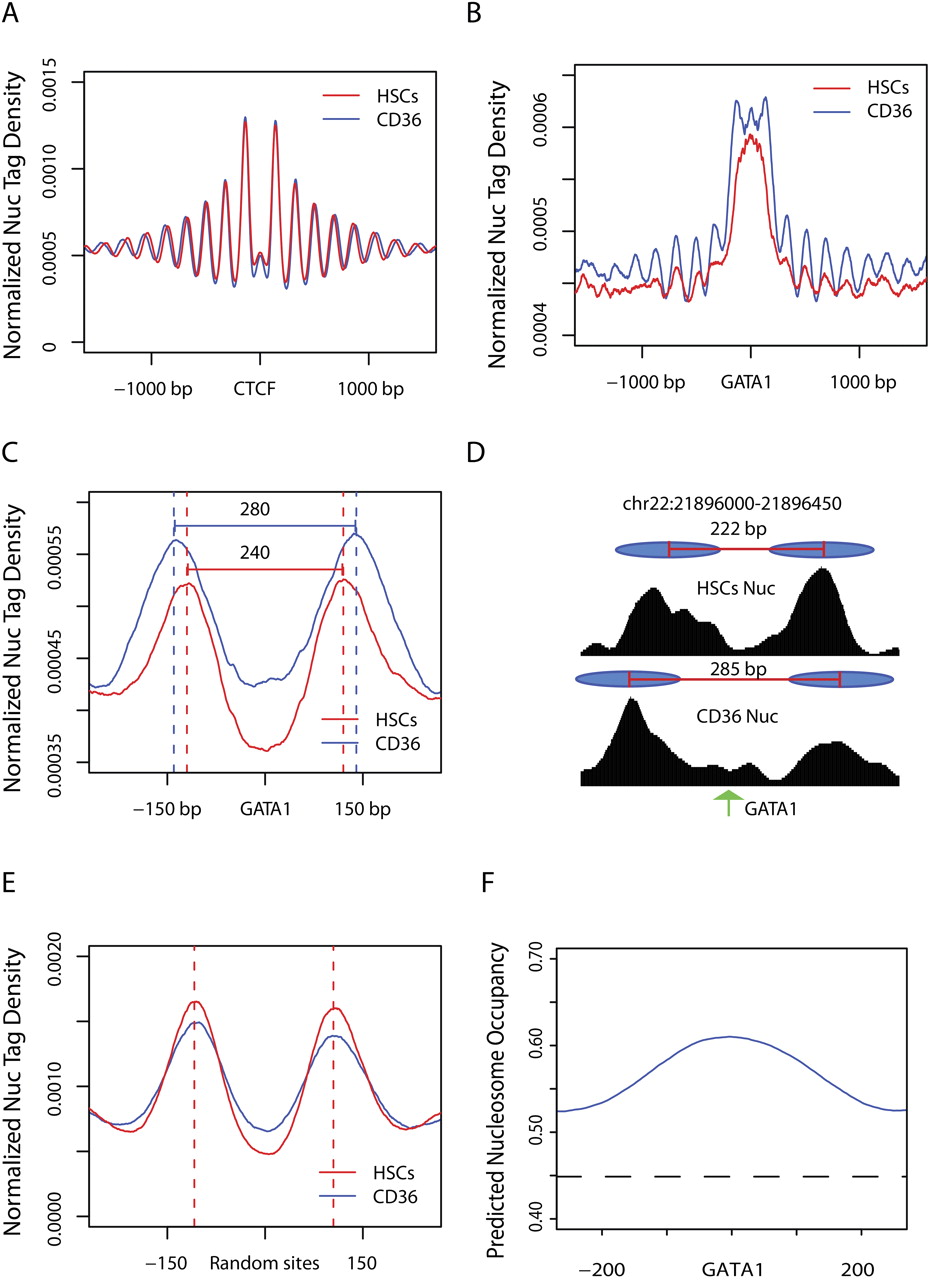
Nucleosomes are reorganized at distal GATA1 binding sites during differentiation of HSCs. (A) Nucleosomes are well positioned surrounding the 18,777 CTCF binding sites shared by both HSCs and CD36+ cells. The nucleosome distribution in HSCs and CD36+ cells was obtained using MNase-seq, and the normalized nucleosome tag densities were plotted for a 3-kb region surrounding the CTCF binding sites. The genomic averages are about 0.0003 for both libraries. (B) The normalized nucleosome tag densities were plotted for a region of ±1500 bp surrounding the 24,491 distal GATA1 sites in HSCs and CD36+ cells. (C) The same as in B, except that only the 20,284 GATA1 binding sites that are located in the linker region in HSCs are shown for a region of ±250 bp surrounding the GATA1 sites. (D) UCSC Genome Browser images showing the nucleosome tag densities in HSCs and CD36+ cells surrounding a GATA1 binding site on chr22. The inferred nucleosome positions are indicated by filled ovals. The summit of GATA1 binding in CD36+ cells is indicated by an arrow. (E) The same as in C, except for a set of randomly chosen genomic sites located in linker regions. (F) Predicted nucleosome occupancy surrounding the 20,284 distal GATA1 sites that are located in the linker regions in HSCs, based on intrinsic DNA sequence preferences of nucleosome formation (Kaplan et al. 2009). Genomic averages are shown by dashed line.


