
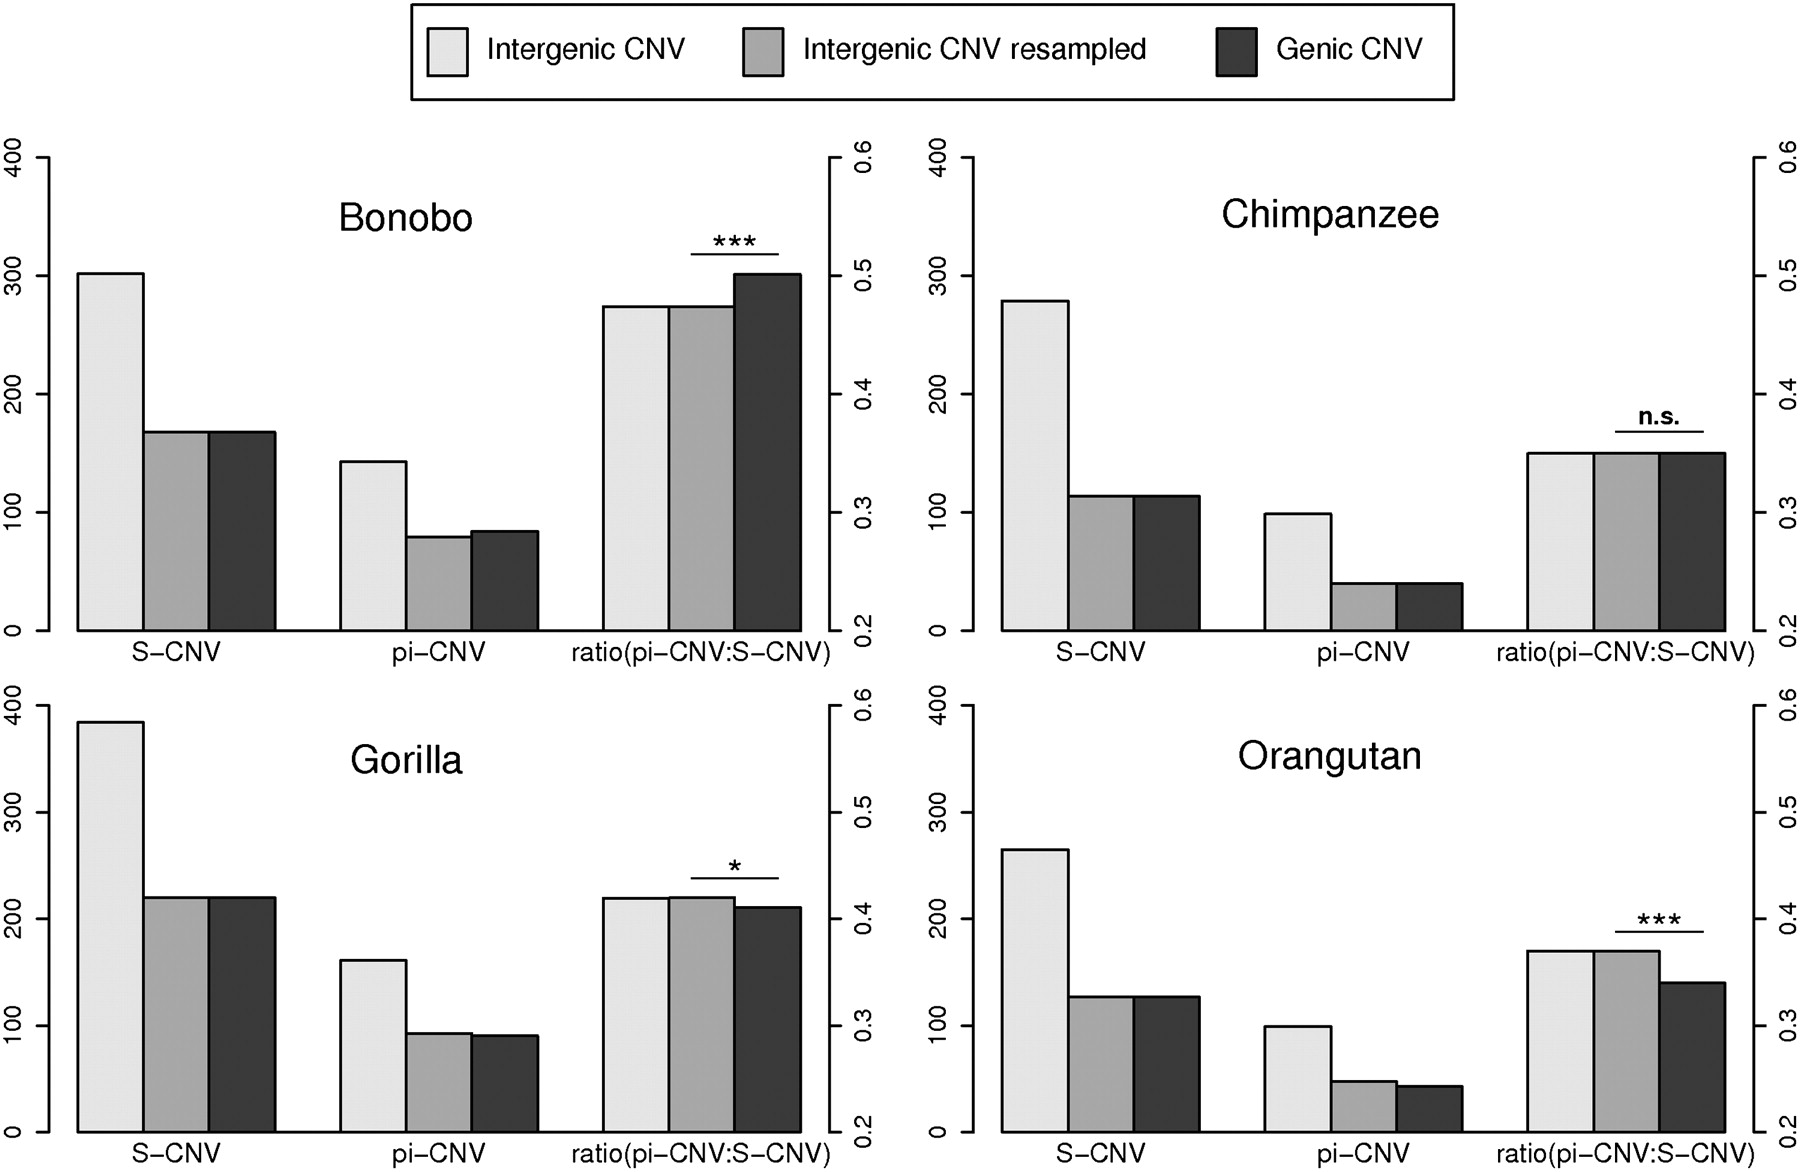
Figure 5.
Patterns of CNV diversity in the four species. The left axis gives the scale of the πCNV and SCNV values and the right axis scale shows the values of their ratio. In each case, intergenic CNVs are resampled because they are always more numerous than genic CNVs. Values of intergenic πCNV resampled are the mean πCNV obtained in 100,000 random resamplings of N intergenic CNV, N being the number of genic CNV (SCNV genic). We can observe that the resampling procedure maintains the ratio.


