
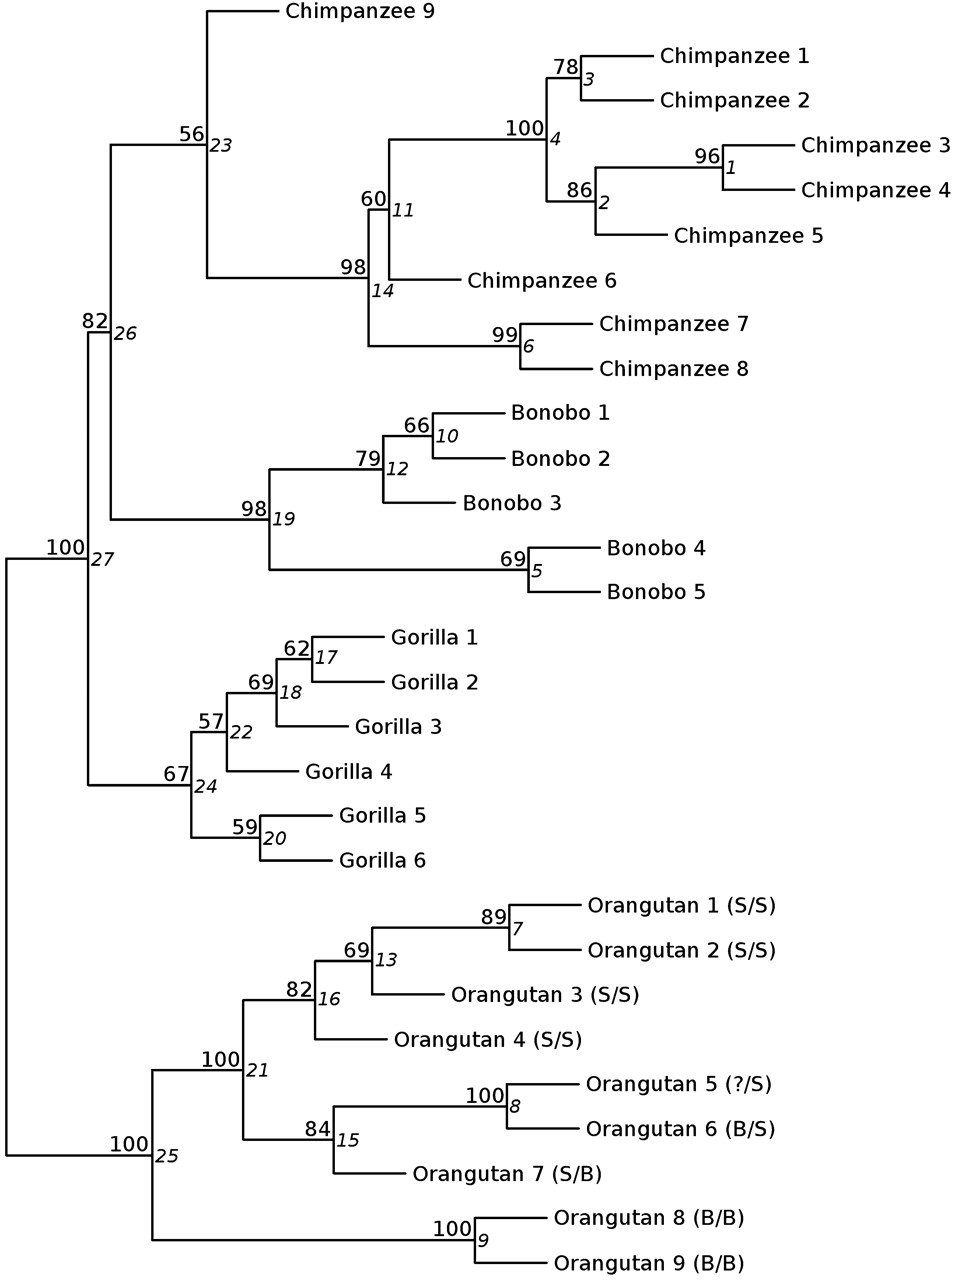
Figure 3.
CNVR clustering tree. Dendrogram showing individuals clustered on the basis of their CNVR similarities. Numbers on the upper lefthand side of each node indicate bootstrap values. Numbers on the righthand side of each node (in italic) are edge numbers. S and B next to the orangutan individuals stand for Sumatra or Borneo, the ancestral geographical origin of the samples. The first letter represents the origin of the sample and the second letter is for the origin of the reference. Individuals are called by short names that are defined in Supplemental Table S1.


