
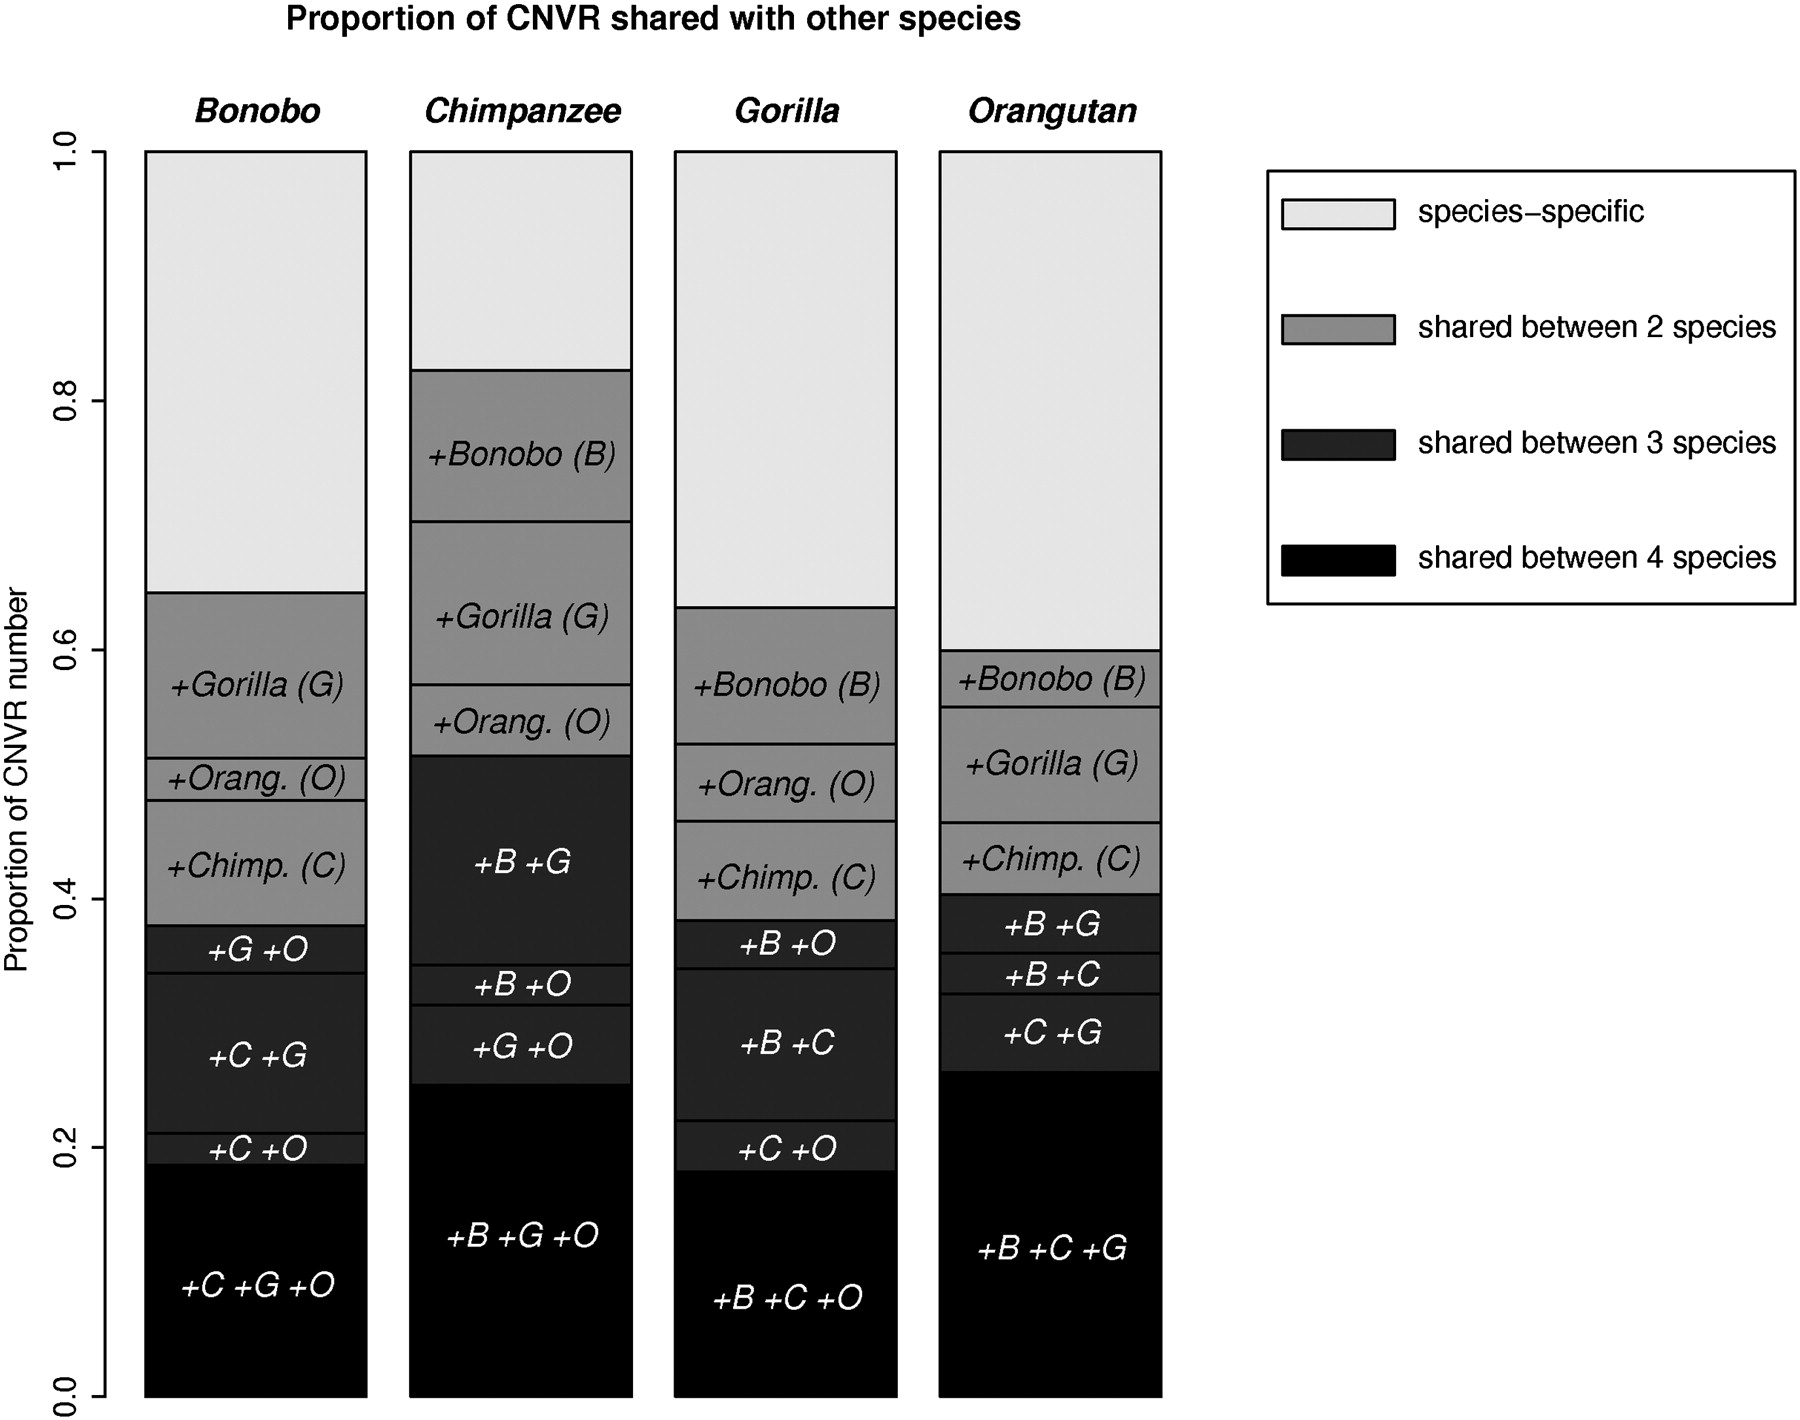
Figure 2.
CNVR interspecific comparison. For each species, the proportion of its CNVR shared with none, one, two, or three other species is plotted.
(Downloading may take up to 30 seconds. If the slide opens in your browser, select File -> Save As to save it.)
Click on image to view larger version.
CNVR interspecific comparison. For each species, the proportion of its CNVR shared with none, one, two, or three other species is plotted.
 CiteULike
 Delicious
 Digg
Digg Facebook
 Google+
 Reddit
 Twitter
