
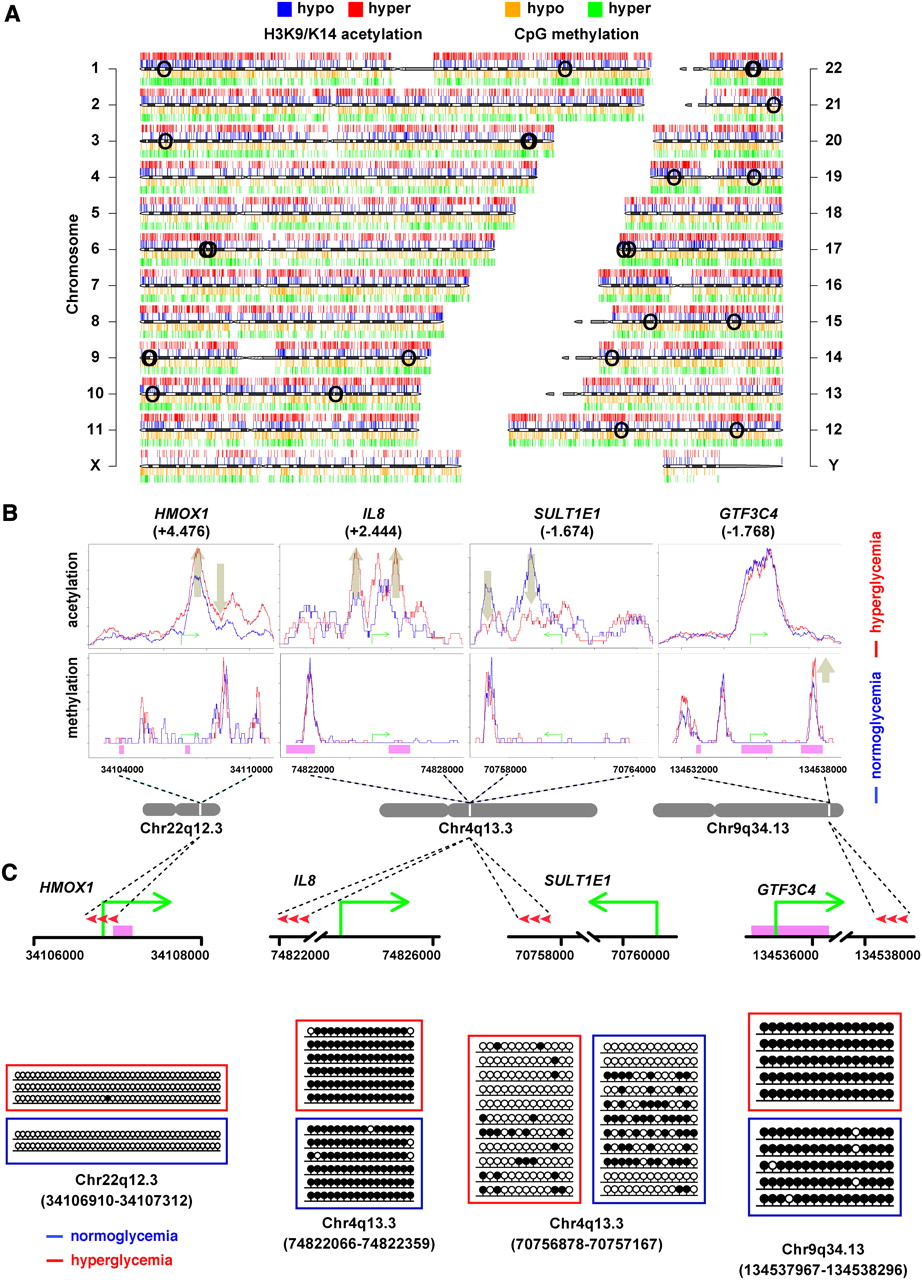
Genome-wide changes conferred by hyperglycemia in the human vascular cell. (A) Human ideogram illustrating the correlation between histone acetylation and the methylome mediated by hyperglycemia. ChIP-seq tracks for hypo- (blue) and hyper- (red) acetylated histone H3K9/K14 are shown above each individual chromosome. CpG-seq tracks for hypo- (orange) and hyper- (green) methylated CpG sequences are shown below each chromosome. (○) Genome localities of individual SNPs associated with diseases listed in Table 5. (B) Mapping specific hyperglycemia-induced histone acetylation and genomic methylation signatures associated with changes in gene expression. H3K9/K14 acetylation and CpG methylation signatures are shown for normoglycemia (blue) and hyperglycemia (red) relative to the transcription start site shown by a green arrow for HMOX1, IL8, SULT1E1, and GTF3C4 genes. Pink regions represent CpG Islands. (C) Experimental validation of CpG-seq tags using bisulfite sequencing of HMOX1 (position chr22:34106910–34107312, region size 403 bp), IL8 (position chr4:74822066–74822359, region size 294), SULT1E1 (position chr4:70756878–70757167, region size 290), and GTF3C4 (position chr9:134537967–134538296, region size 330). (•) Methylated CpG sites; (○) unmethylated CpG sites. Red arrowheads represent the relative positions of bisulfite sequenced amplicons.


