
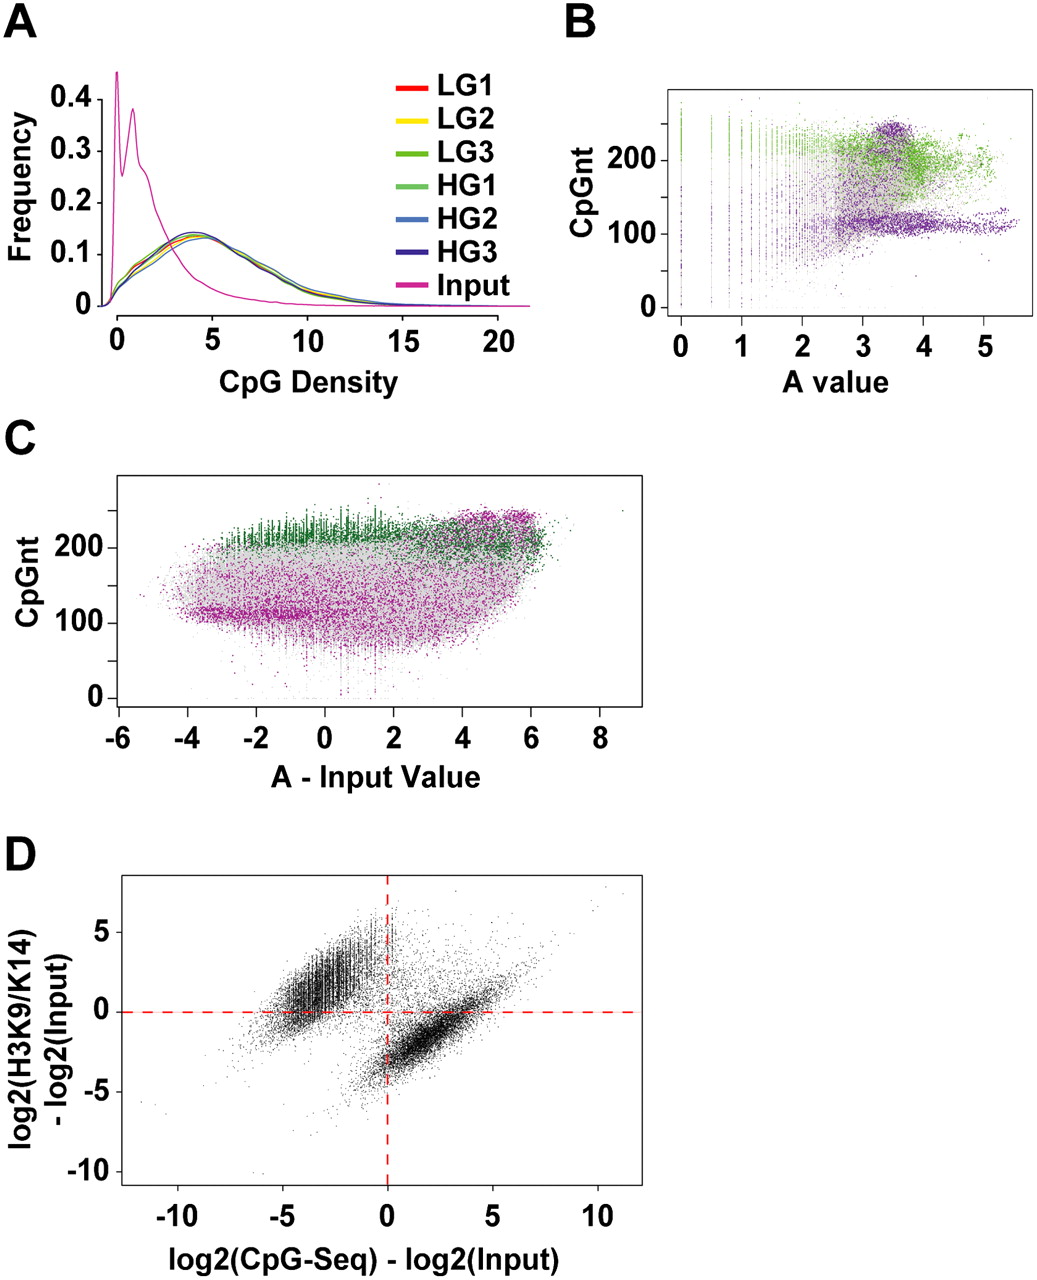
Distribution of CpG-seq tags in human vascular cells. (A) Enrichment of CpG sequences determined by comparing methyl-capture against the input. Shown here are three experiments of libraries prepared for CpG-seq derived from vascular endothelial cells exposed to low-glucose (LG) or high-glucose (HG) conditions. (B) Distribution of CpG-seq-enriched DNA with respect to C+G counts in 300-bp bins. Green indicates reads localized to CpG islands and purple indicates reads mapping to repeat sequences. (C) Representation of methylated DNA distributed between CpG islands (green) and repeat sequences (purple). Read counts are normalized for 300 bp and subtracted from the same count of input samples. (D) Relationship between the normalized and input-subtracted values of histone acetylation (y-axis) and CpG methylation (x-axis). The plot shows a mutually exclusive distribution of hyperacetylated and unmethylated regions (upper left) distinguished from methylated CpGs and hypoacetylated sites (lower right). The Fisher-exact probability for this quadrant distribution shown by the red dotted axes is estimated at P = 10−75.


