
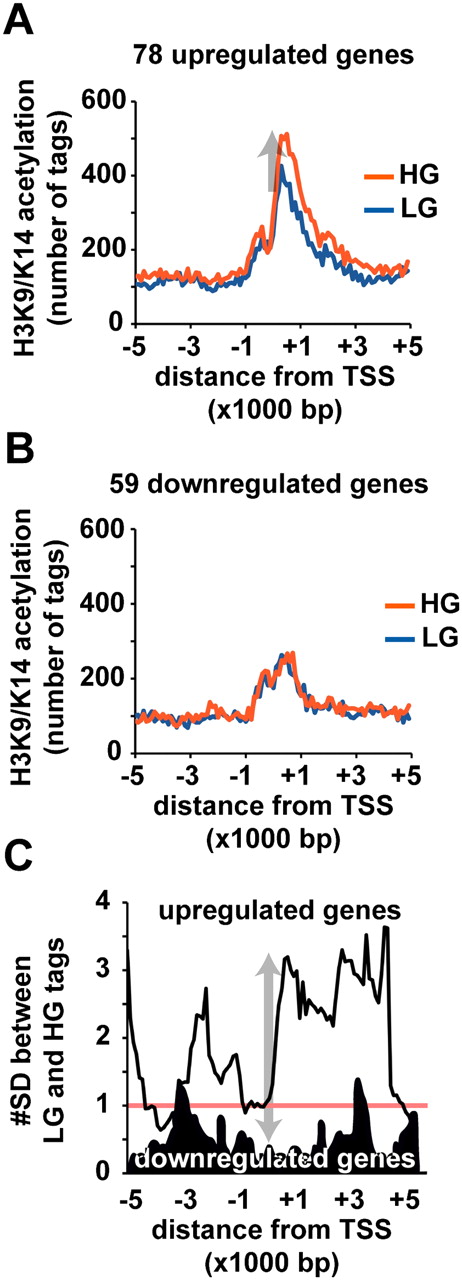
Hyperglycemia confers genome-wide H3K9/K14 acetylation patterns close to the transcription start site of promoters in human vascular cells. (A) Genomic positions of sequenced tags are grouped in 100-bp windows relative to the 78 genes with expression values >1.5-fold. (B) Analysis of 59 down-regulated genes with expression values >1.5-fold. Plots are expressed relative to transcription start sites determined on the human NCBI genome build 36.1. The cumulative number of tags within each 100-bp window is plotted relative to the transcription start site. (Blue line) LG exposed HAECs; (red line) HG exposed HAECs. (C) Sliding window calculation demonstrates significant difference between HG and LG traces relative to the pool of up-regulated genes (light trace) and down-regulated genes (dark trace).


