
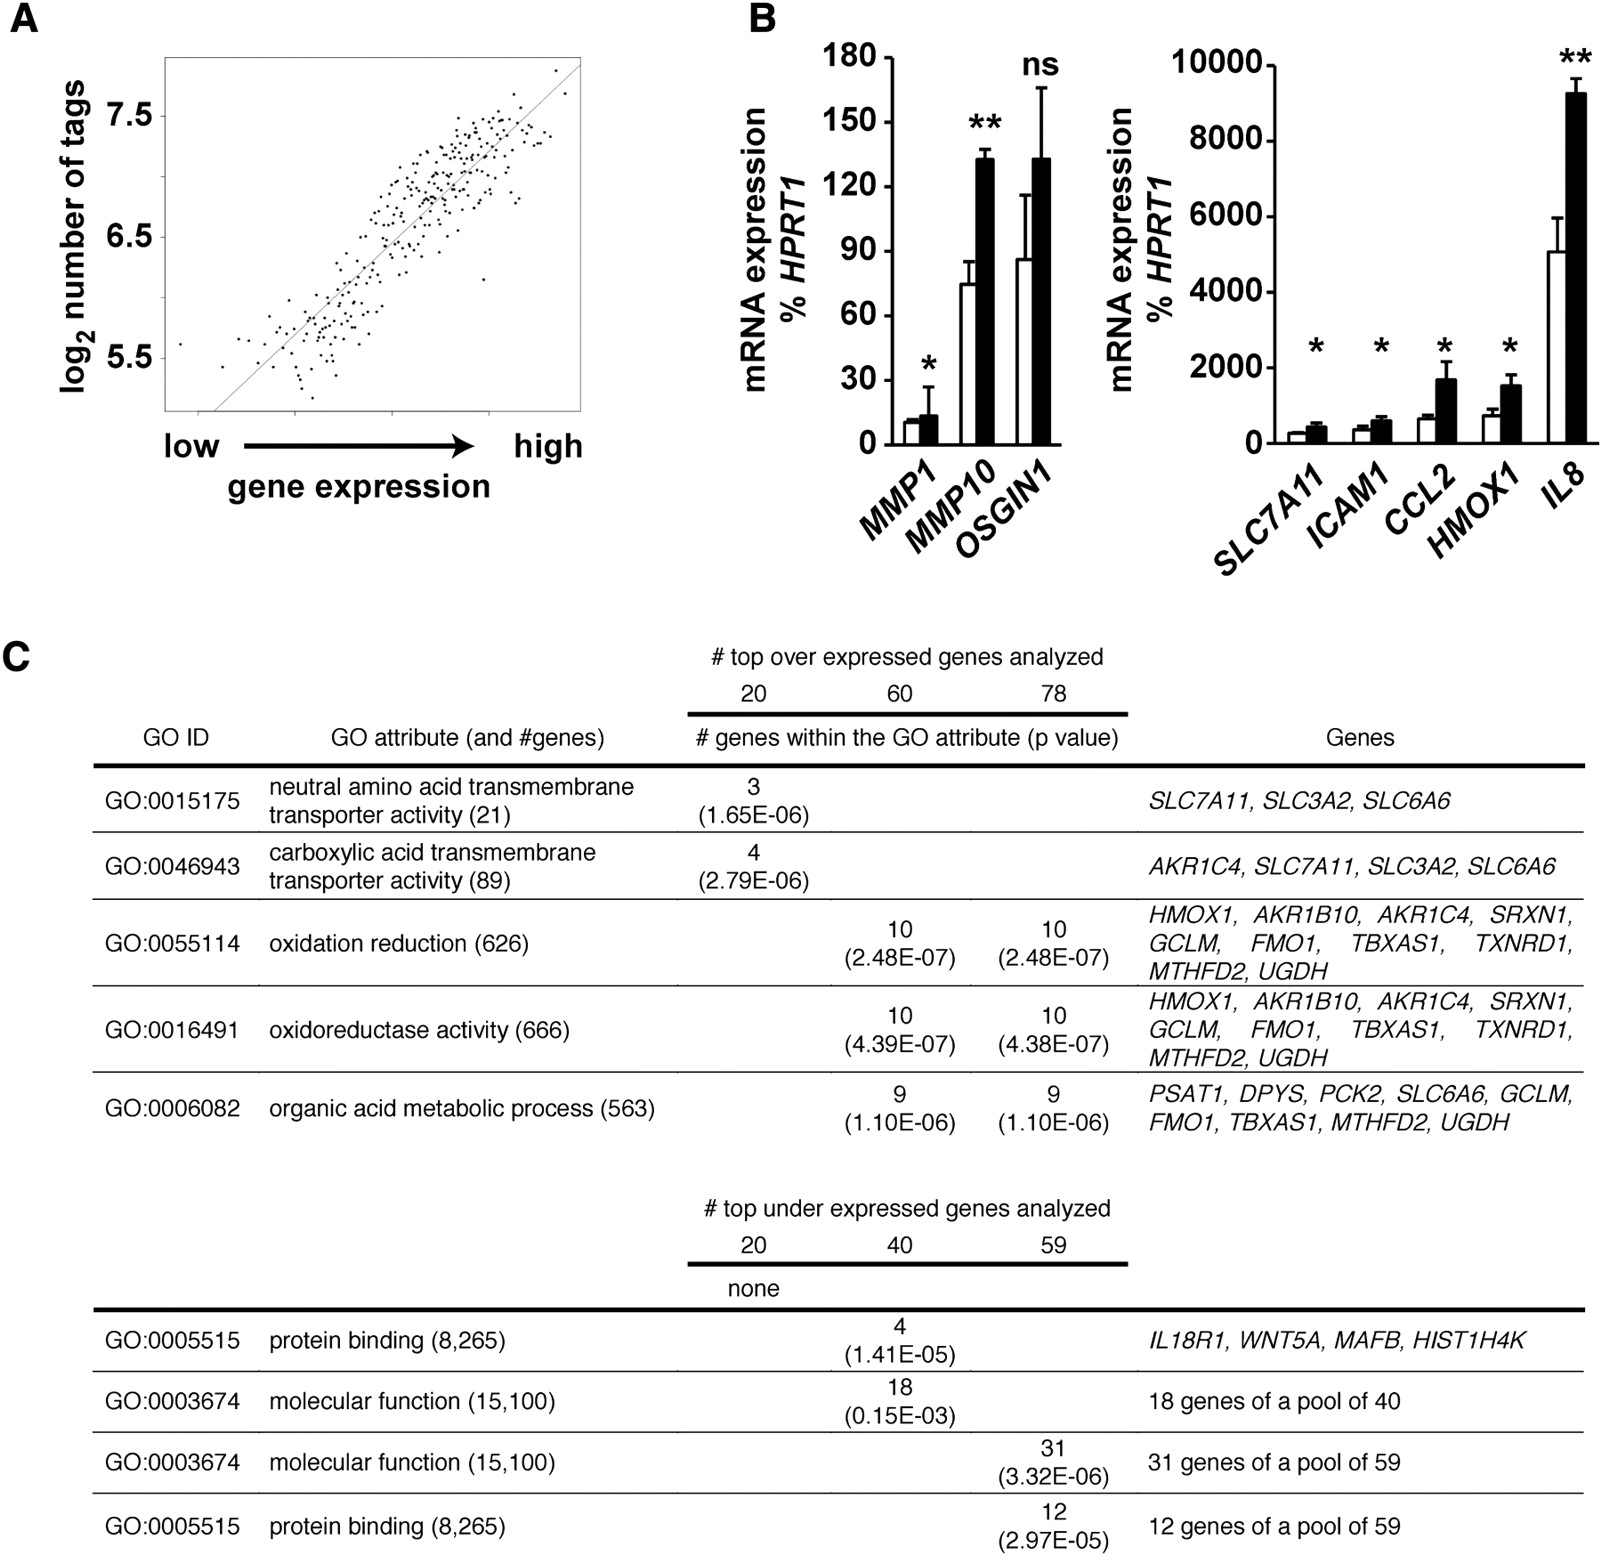
Relationship between mRNA expression and histone acetylation with gene ontologies in primary human vascular cells. (A) Genes were pooled according to expression in groups of 20 and the number of tags from ChIP-seq experiments (−1 to +1 kb TSS) was calculated. (B) Validation by quantitative real-time PCR of mRNA expression changes mediated by hyperglycemia. Values are displayed as % expression of the housekeeping gene HPRT1, which does not change significantly in response to hyperglycemia. Empty bars represent LG-treated HAECs; black bars represent HAECs exposed to HG. (*) P < 0.05, paired t-test; (**) P < 0.01, paired t-test; (ns) not significant. n ≥ 3. Quantitative real-time PCR reactions for each independent replicate were performed in duplicate. (C) Gene ontologies defined for the subset of up-regulated (20, 60, and 78) genes and down-regulated (20, 40, and 59) genes mediated by hyperglycemia.


