
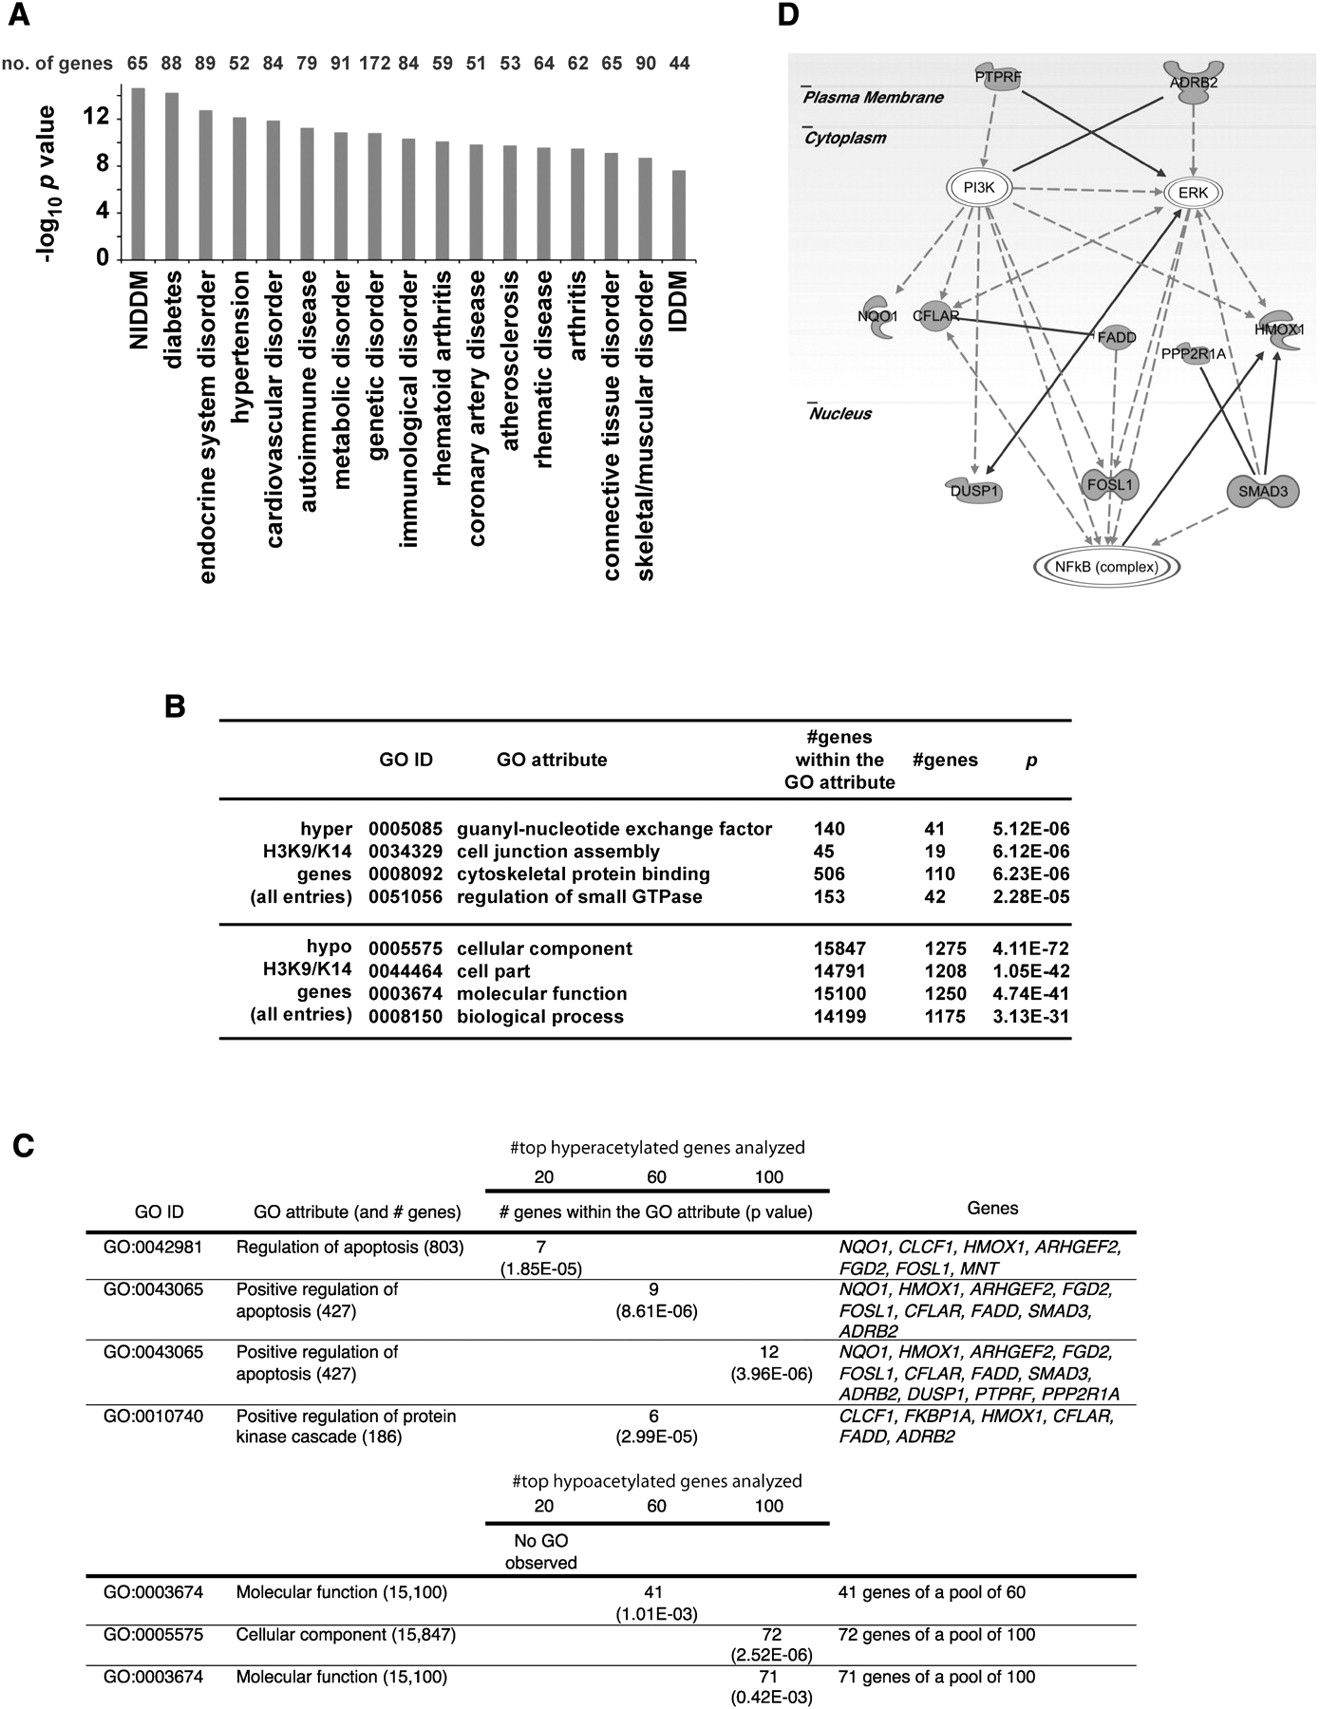
Distribution of hyperglycemia-induced genes with differentially acetylated regions in primary human vascular cells. (A) Annotations for genes containing H3K9/K14 acetylation conferred by hyperglycemia were performed by Ingenuity System software analysis. Functional annotations are ranked according to their degree of significance with pathological condition. The number of genes contributing to the analysis is reported with 17 of the top 21 hits identified with functional or physiopathological links to hyperglycemic damage. The full list of genes is presented in Supplemental Table 2. (NIDDM) Non-insulin-dependent diabetes mellitus; (IDDM) insulin-dependent diabetes mellitus. (B) Gene ontologies (GOs) have been defined for H3K9/K14 hyperacetylation and hypoacetylation. For each GO association, the number of genes within a GO attribute and the number of observed genes is reported. (C) Hyperglycemia determined GOs have been ranked and defined for 20, 60, and 100 genes associated with genomic regions displaying the most significant increase or decrease in H3K9/K14 acetylation. (D) Representative Ingenuity Pathway Analysis map generated for the subset of hyperacetylated genes conferred by hyperglycemia representing the GO attribute “Positive regulation of apoptosis.”


