
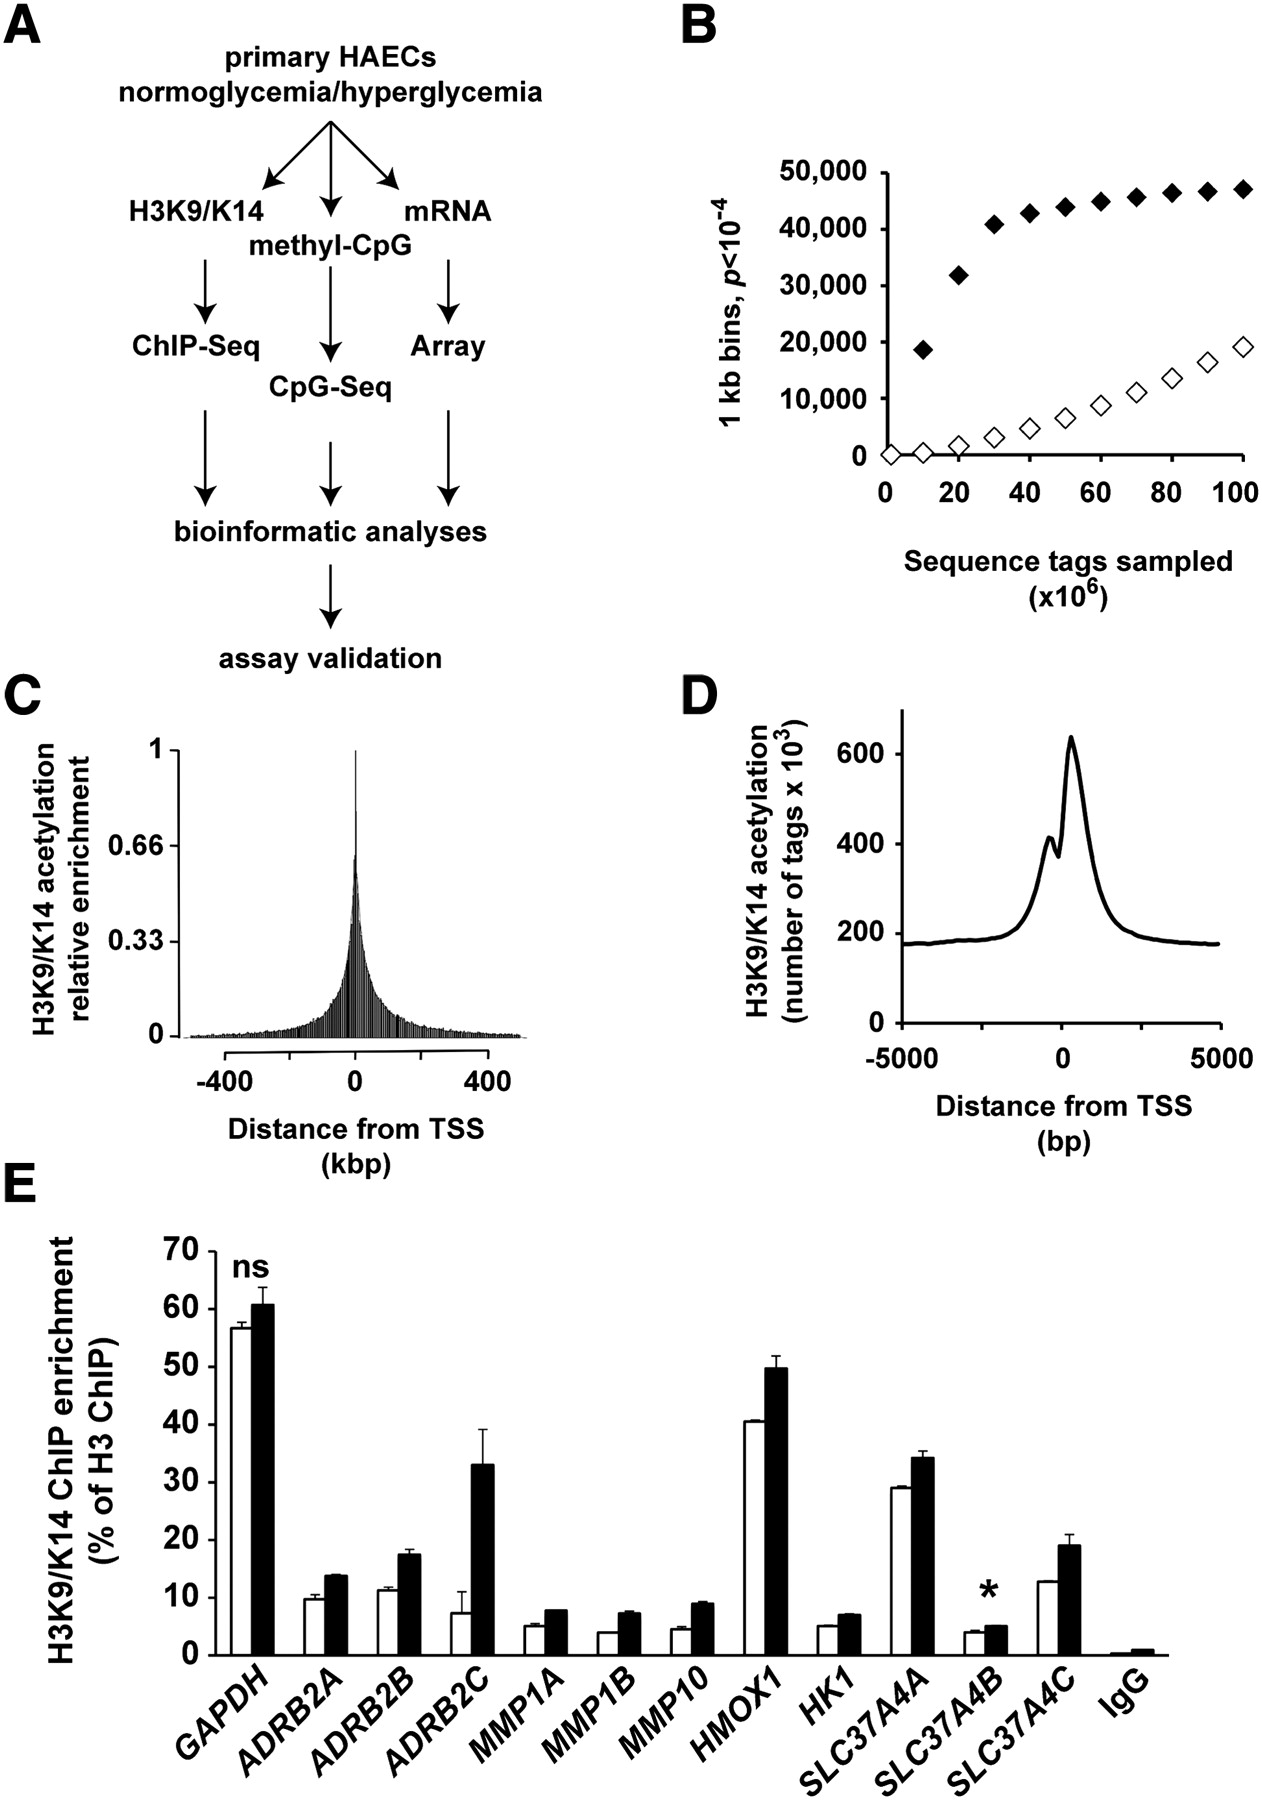
Study-power analysis and distribution of sequenced tags around the TSS of genes. (A) General schematic plans of the experiments and analyses performed in this study. (B) ChIP-seq-derived tags from independent experiments were pooled in 1-kb windows. For each 1-kb window, a Poisson test was applied to achieve P-value. (♦) H3K9/K14 acetylation LG ChIP-seq versus input; (◊) H3K9/K14 acetylation LG versus HG ChIP-seq. (C,D) The positions of all sequenced tags, pooled in 2.5-kbp and 100-bp windows, are expressed relative to the nearest genomic TSS determined on the human NCBI genome build 36.1. (C) Visualization of relative enrichment on a 1-Mbp window identifies that H3K9/K14 acetylation decreases exponentially on both sides of the TSS. (D) Visualization of relative enrichment on a 10,000-bp window centered on the TSS. (E) Validation by quantitative PCR of ChIP-seq differential tag enrichments. H3K9/K14 acetylation was monitored in 12 genomic regions from seven genes derived from independent experiments. Enrichments were normalized to H3. Specificity was assessed using IgG antibody. Differences in all analyzed results are statistically significant (P < 0.05, unpaired t-test) excluding GAPDH ([ns] not significant, P = 0.21). SLC37A4 amplicon B ([*] P = 0.057).


