
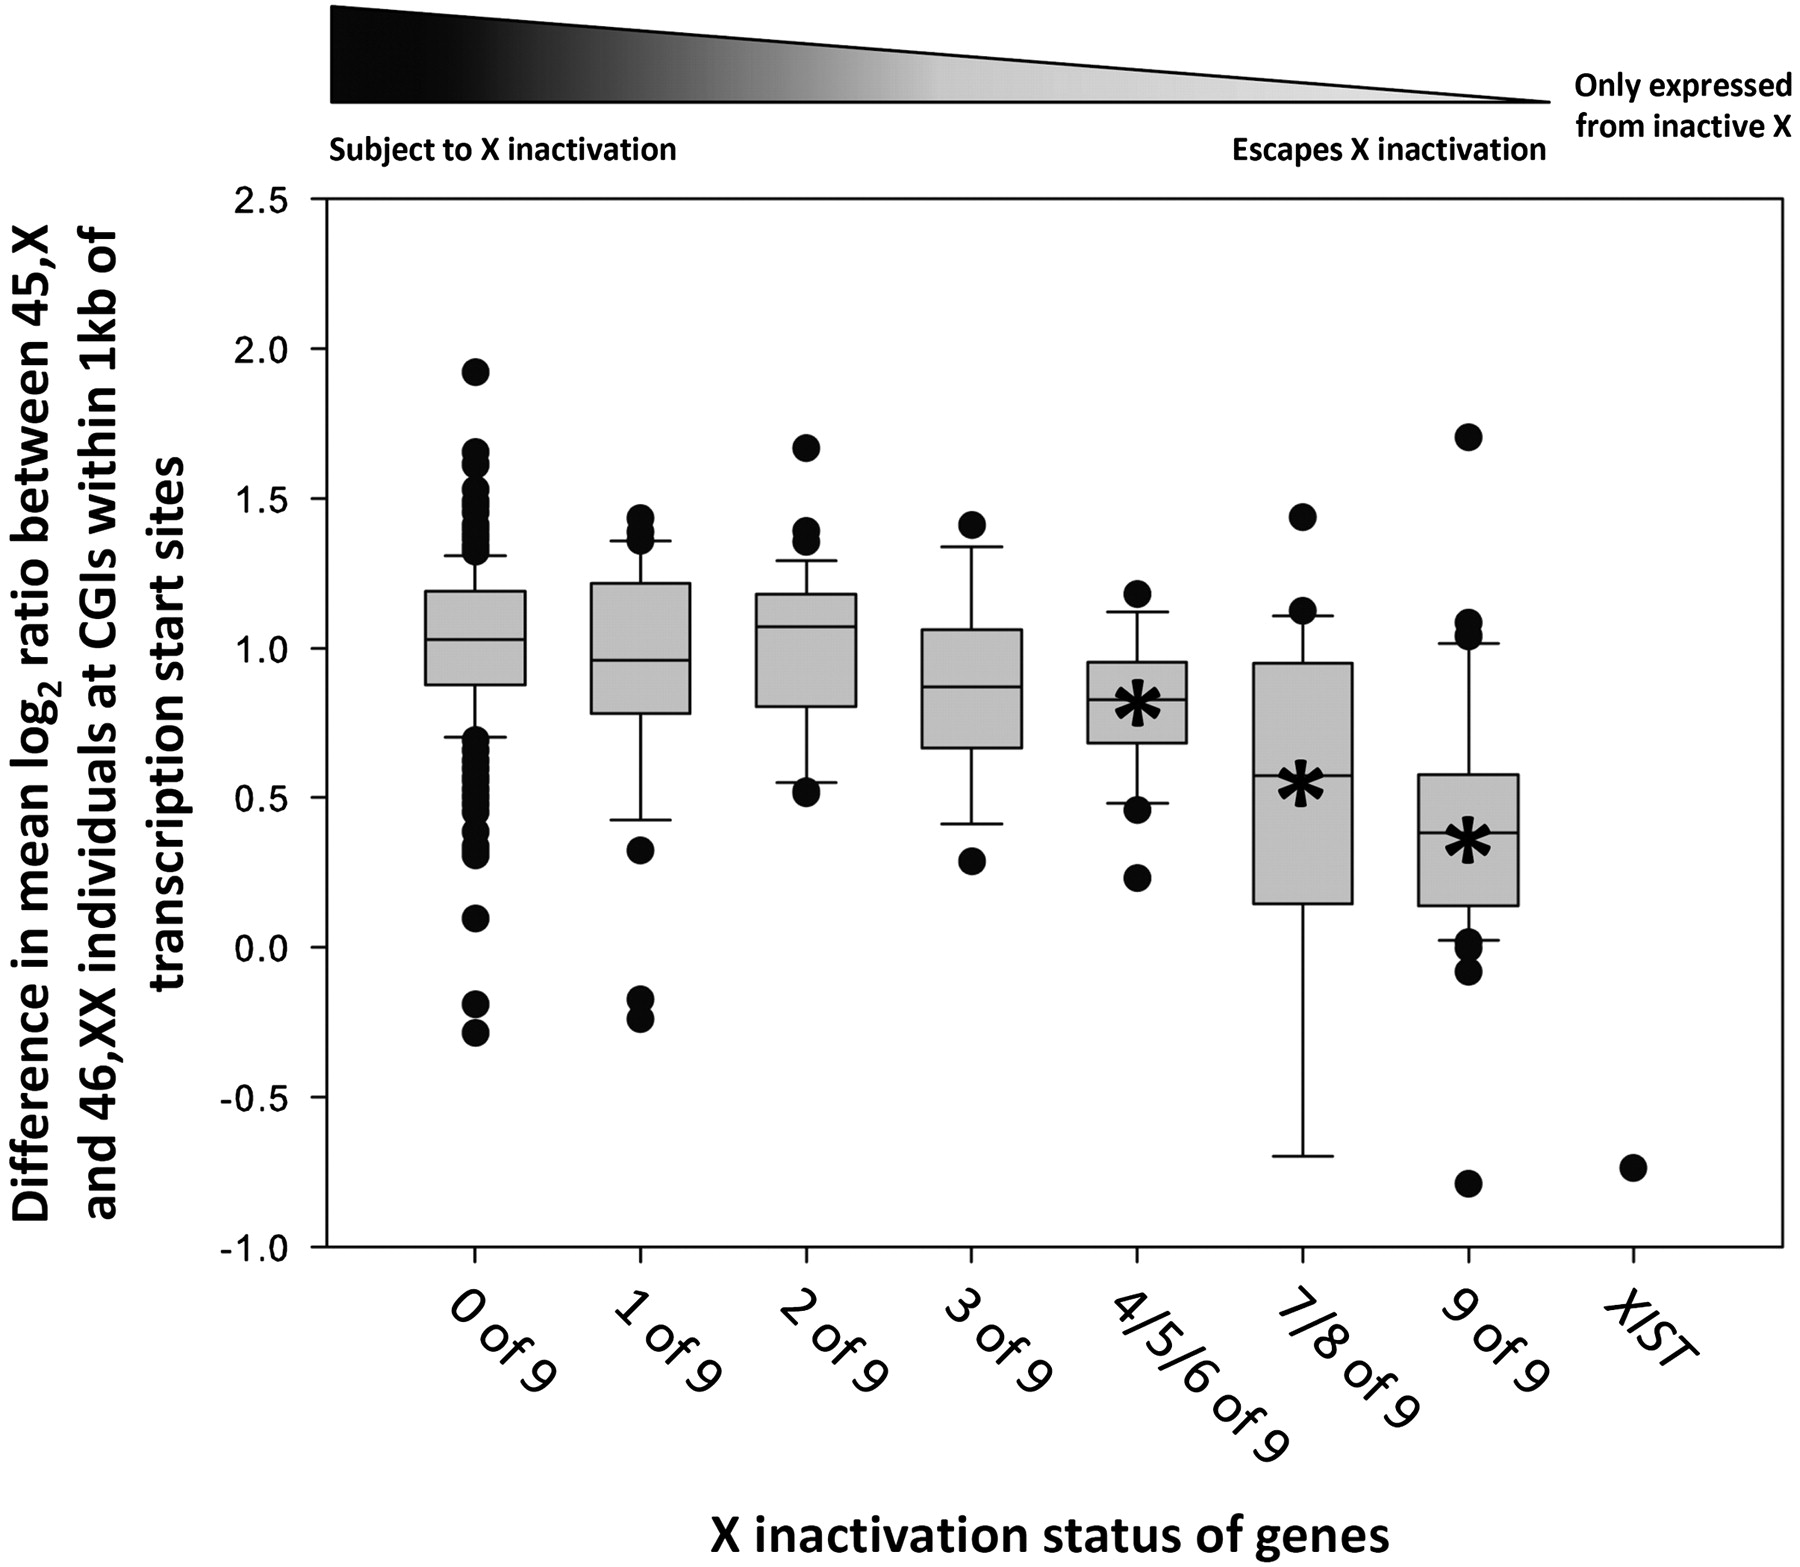
Difference in methylation levels between 46,XX and 45,X individuals at transcription start sites is inversely correlated with X-inactivation status. Boxplots show the mean methylation of CGIs located within 1 kb of the TSS of 363 RefSeq genes scored by Carrel and Willard (2005) for their expression status on the Xi (Supplemental Table 3). Genes are divided based on their expression status on the Xi, with a score from 0 to 9 corresponding to the number of somatic cell hybrids containing an inactive X chromosome that express that gene. Genes with score 0 are always subject to XCI, genes with score 9 always escape XCI, and genes with intermediate scores show polymorphic or unstable inactivation. The XIST gene is unique in being transcribed only from the Xi, and shows lower methylation in 46,XX versus 45,X individuals. Linear regression analysis of XCI score with methylation difference between 46,XX and 45,X yields R2 = 0.18, p < 0.001. ANOVA followed by Tukey analysis showed that genes with scores 4–9 showed statistically significant methylation differences compared to genes with score 0 (Bonferroni-adjusted p < 0.001, indicated by an asterisk within each box). Boxplots define lower and upper quartiles of each distribution, the internal band shows the median, while whiskers correspond to top and bottom deciles. Categories containing less than 15 genes were combined to yield sufficient sample sizes for meaningful comparison.


