
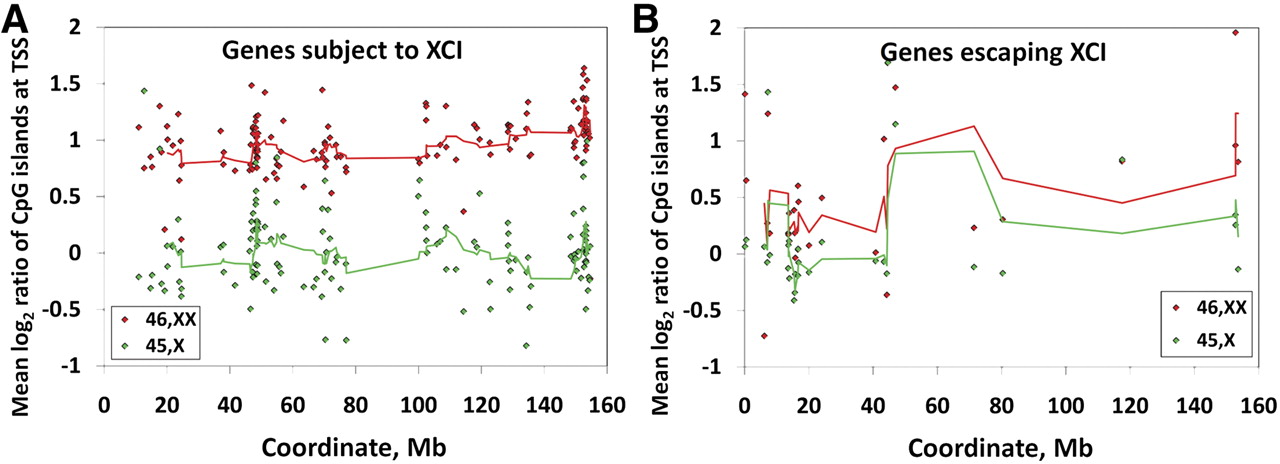
Methylation status of CpG islands at gene promoters varies depending on gene inactivation status. (A) CGIs at promoters of genes subject to XCI show much higher methylation levels in 46,XX compared to 45,X individuals (mean 46,XX log2 methylation = 0.99, mean log2 methylation difference = 1.04, p = 1.3 × 10⁻²³). (B) In contrast, the majority of CGIs at promoters of genes escaping XCI show much lower methylation levels in 46,XX individuals, similar to those seen in 45,X individuals (mean 46,XX log2 methylation = 0.54, mean log2 methylation difference = 0.34, p = 0.00013). Each point represents the mean log2 methylation of a CGI located within 1 kb of the TSS of a RefSeq gene scored by Carrel and Willard (2005) as being (A) silenced on the Xi (expressed in 0 of 9 hybrids containing an inactive X, n = 135), or (B) expressed from the Xi (expressed in ≥8 of 9 hybrids containing an inactive X, n = 29). Colored lines show the moving average of methylation at 10 and 3 CGIs for genes subject to and escaping XCI, respectively. Data for CGIs that lie outside of RefSeq gene promoters are shown in Supplemental Figure 14.


