
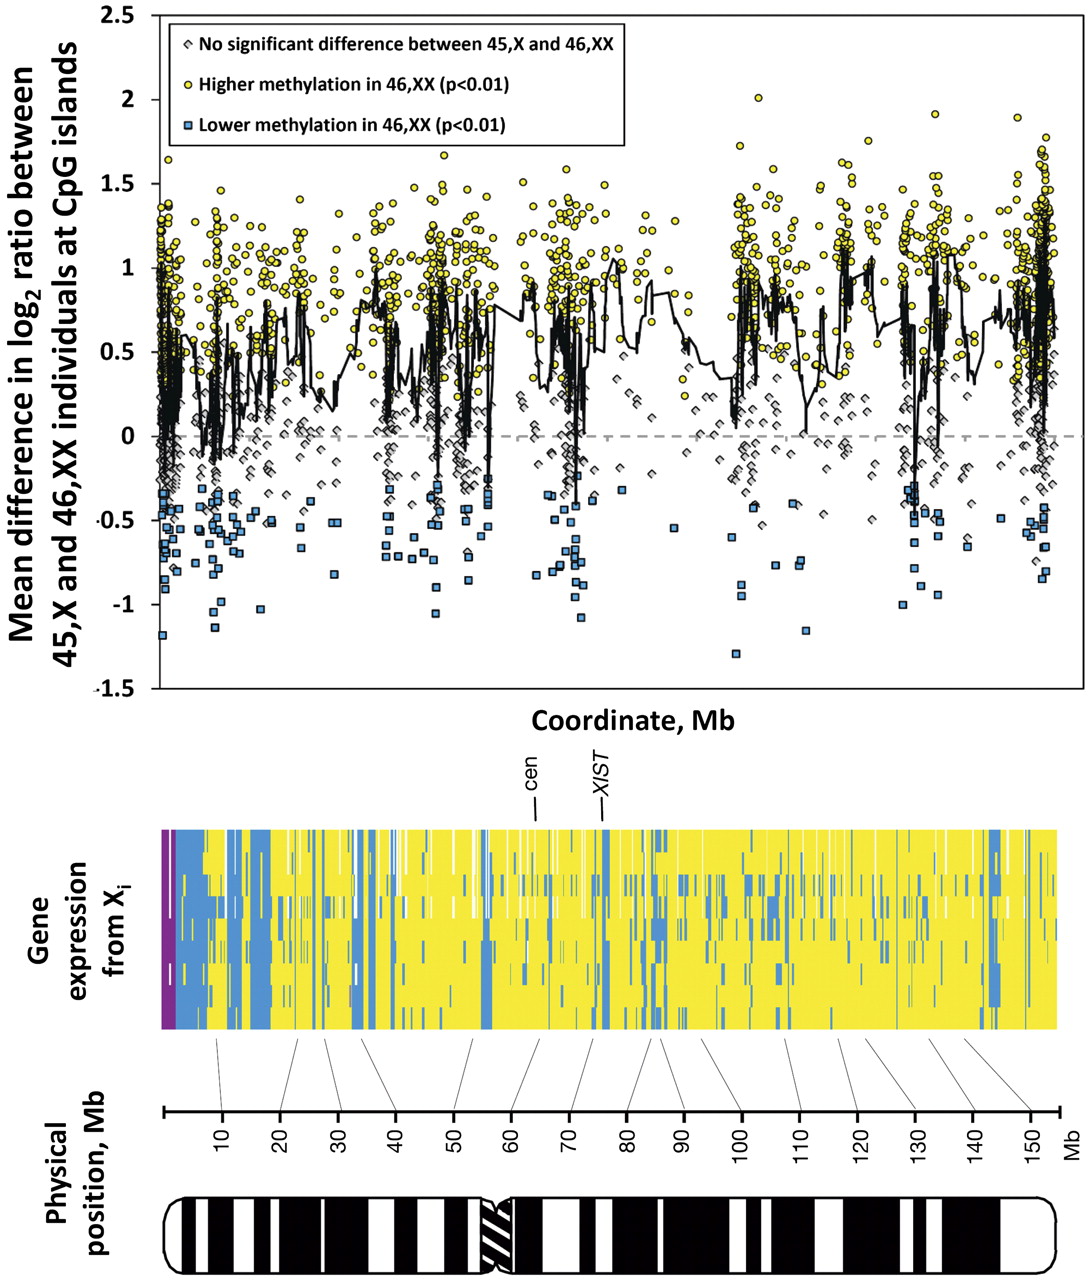
X inactivation results in highly variable changes in methylation of CpG islands that correlate with the location of genes escaping X inactivation. While the majority of CGIs (61%) show increased methylation on the Xi (yellow circles), 7% of CGIs have significantly lower levels of methylation in 46,XX compared to 45,X individuals (blue squares; p < 0.01), contradicting the notion that XCI is always associated with increased methylation. The location of these sites of reduced methylation highly correlates with the physical position of genes known to escape XCI (r = −0.81). (Gray diamonds) The remaining 32% of CGIs showed no significant difference in methylation (p > 0.01). Each point represents the change in mean methylation between 45,X and 46,XX individuals at a CGI (Bock et al. 2007), with the black line showing the moving average of methylation at 10 CGIs. The heat map shows genes expressed from the Xi (blue), silent genes (yellow), pseudoautosomal genes (purple), and untested genes (white) in each of nine cell lines (adapted from Carrel and Willard 2005 and reprinted with permission from Nature Publishing Group © 2005).


