
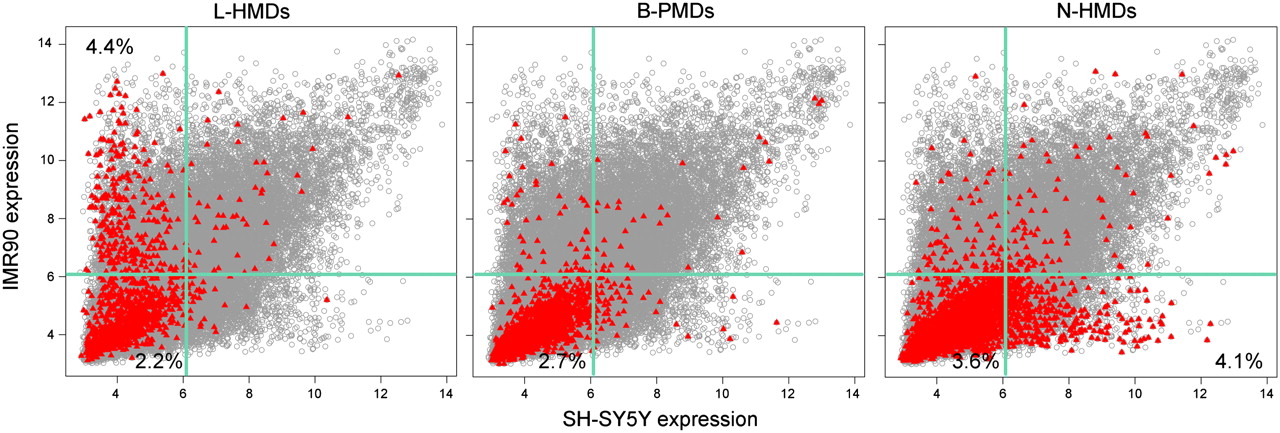
Figure 3.
Cell type specific expression of transcripts contained within PMDs. Gray circles are normalized expression values for all microarray probes, averaged over triplicates in both cell lines. Red triangles represent probes to genes within the specified domain type. Light green lines mark the 75th percentile for expression values. Percentages in each quadrant show the percentage of probes in that PMD type for that quadrant.


