
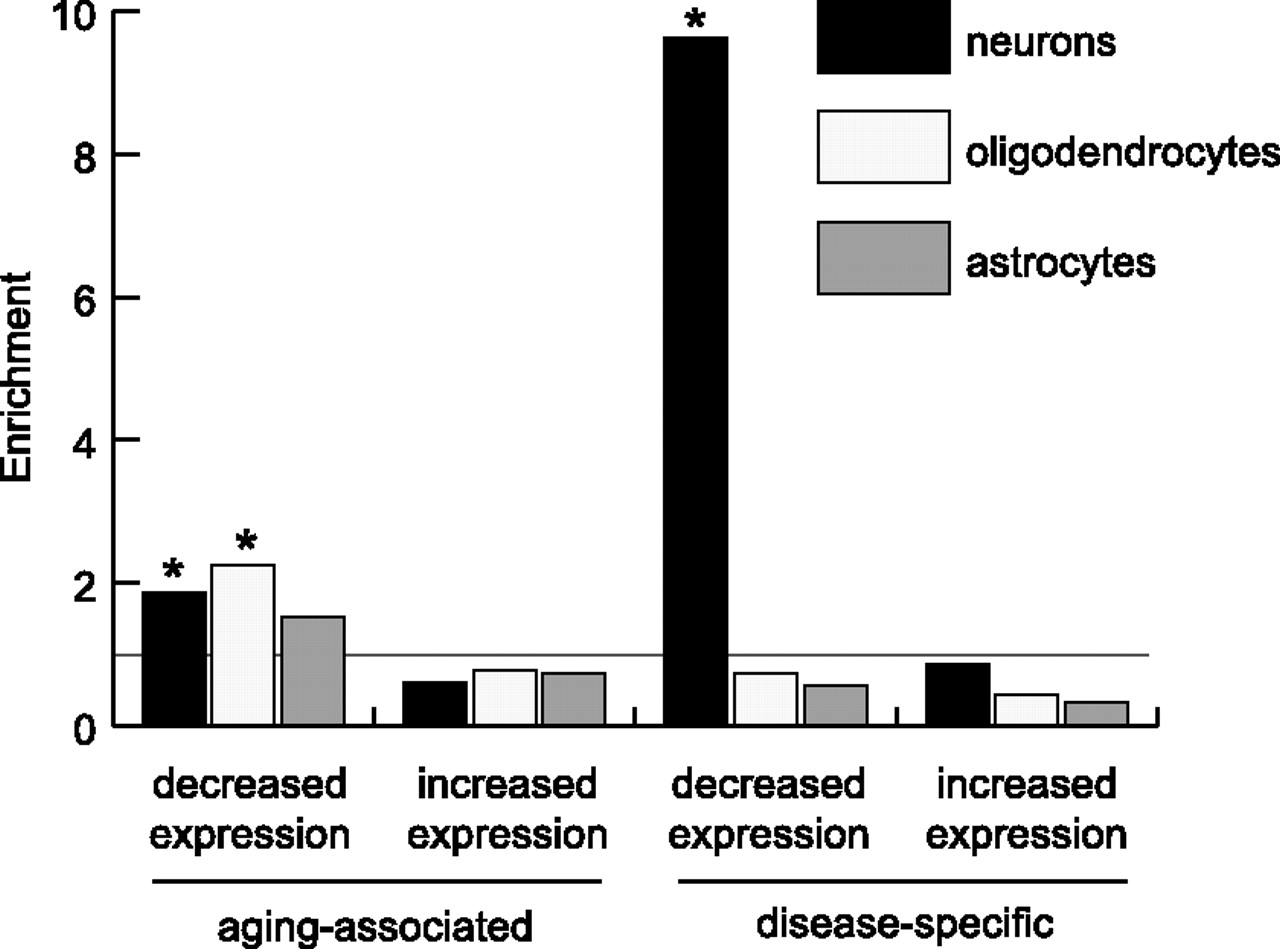
Figure 4.
Analysis of cell-type-specific gene expression. The y-axis shows the enrichment of cell-type-specific genes (Cahoy et al. 2008) (see Methods) among the genes with increased or decreased age-related or disease-specific changes in transcript levels. (*) Significant difference in proportion of cell-type-specific genes (P-value < 0.0001, χ2 test with Yates correction).


