
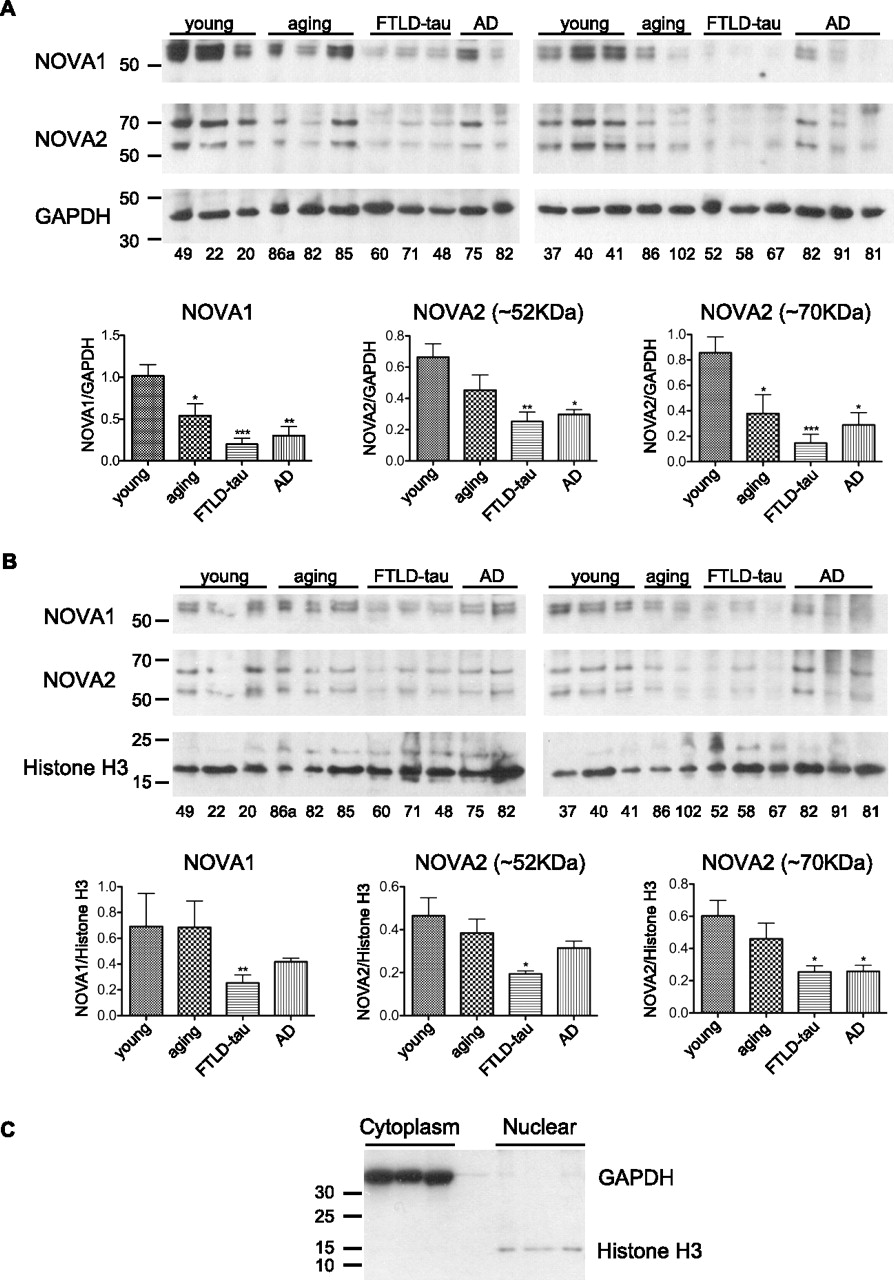
Analysis of the nuclear and cytoplasmic abundance of NOVA proteins. A total of six young healthy, five aging healthy, six FTLD-tau, and five AD samples were lysed into cytoplasmic (A) and nuclear (B) fractions. Immunoblot analysis of NOVA1, NOVA2 (detected in two different isoforms of ∼52 kDa and 70 kDa), and cytoplasmic (GAPDH) and nuclear (Histone H3) loading controls is shown. Mean and standard deviation of NOVA signal, normalized against the loading controls, is shown in the graphs. Significant difference in NOVA protein abundance is marked; (*) P-value < 0.05; (**) P-value < 0.01; two-sided Student's t-test, unequal variance. (C) Separation of cytoplasmic and nuclear fractions from human post-mortem samples was efficient. GAPDH was only present in the cytoplasmic fraction, whereas histone H3 was present only in the nuclear fraction.


