
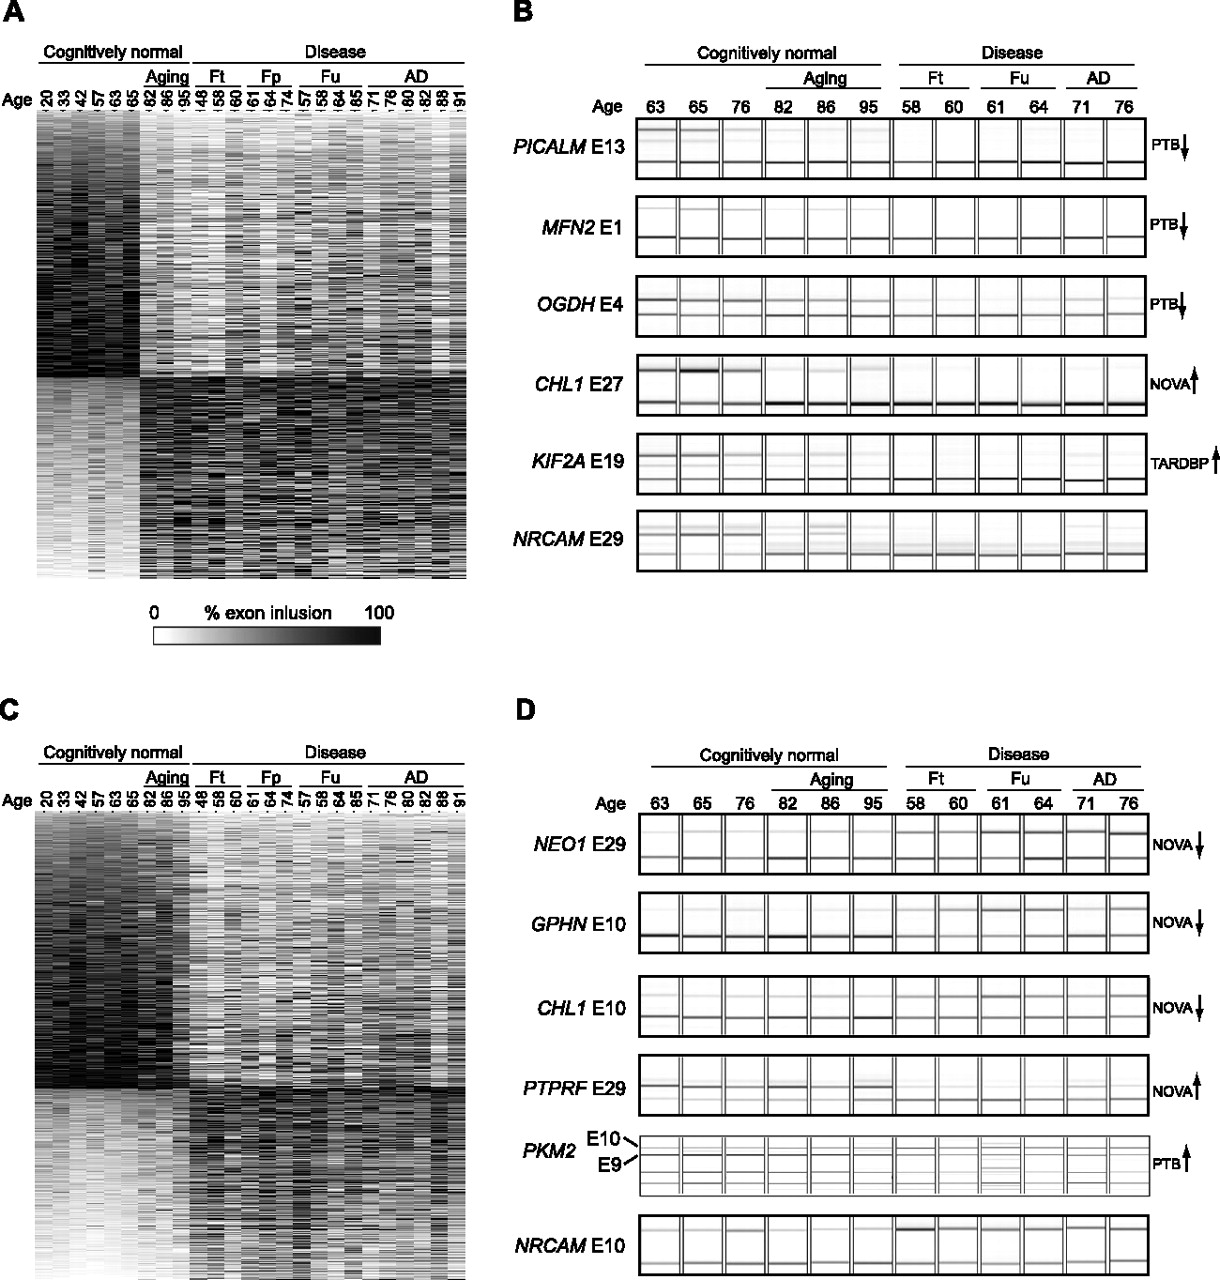
Analysis of age-related and disease-specific splicing changes. (A) Heatmap of percentage exon inclusion of the 2064 exons with age-related splicing changes (DAR < 1.2). (B) RT-PCR validation of a cohort of the age-associated splicing changes. (C) Heatmap of percentage exon inclusion of the 1551 exons with disease-specific splicing changes (DAR > 2). (D) RT-PCR validation of the disease-specific splicing changes. Exons regulated by TARDBP, NOVA, or PTB proteins are labeled on the side, with the enhancing or silencing activity of the protein indicated by an arrow. Age of individual donors and the disease type is shown on top; (Ft) FTLD-tau; (Fp) FTLD-TDP with GRN mutation; (Fu) sporadic FTLD-TDP.


