
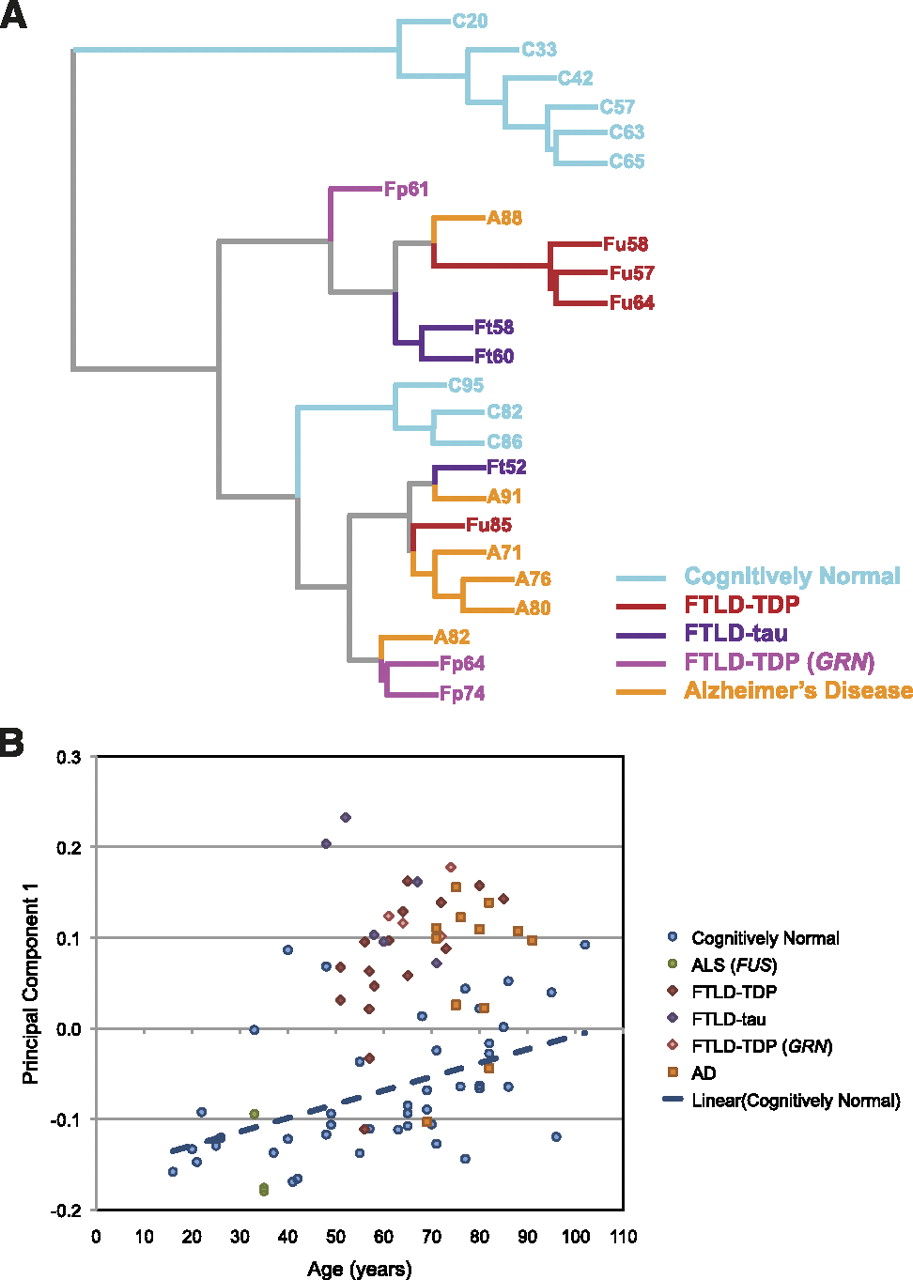
Figure 1.
Overview of microarray and RT-PCR analyses of splicing profiles. (A) Hierarchical clustering of microarray data [(C) cognitively normal; (Ft) FTLD-tau; (Fp) FTLD-TDP with GRN mutation; (Fu) sporadic FTLD-TDP; (AD) Alzheimer's disease], with ages of individuals shown next to disease status. (B) Principal component analysis of RT-PCR data of 13 exons in 84 samples (data shown in Supplemental Fig. S2; Supplemental Tables S1, S2). PC1 values are compared to the age of the donor. The blue line shows the linear regression analysis of the cognitively normal individuals, indicating a trend for a more disease-like splicing pattern with increasing age.


