
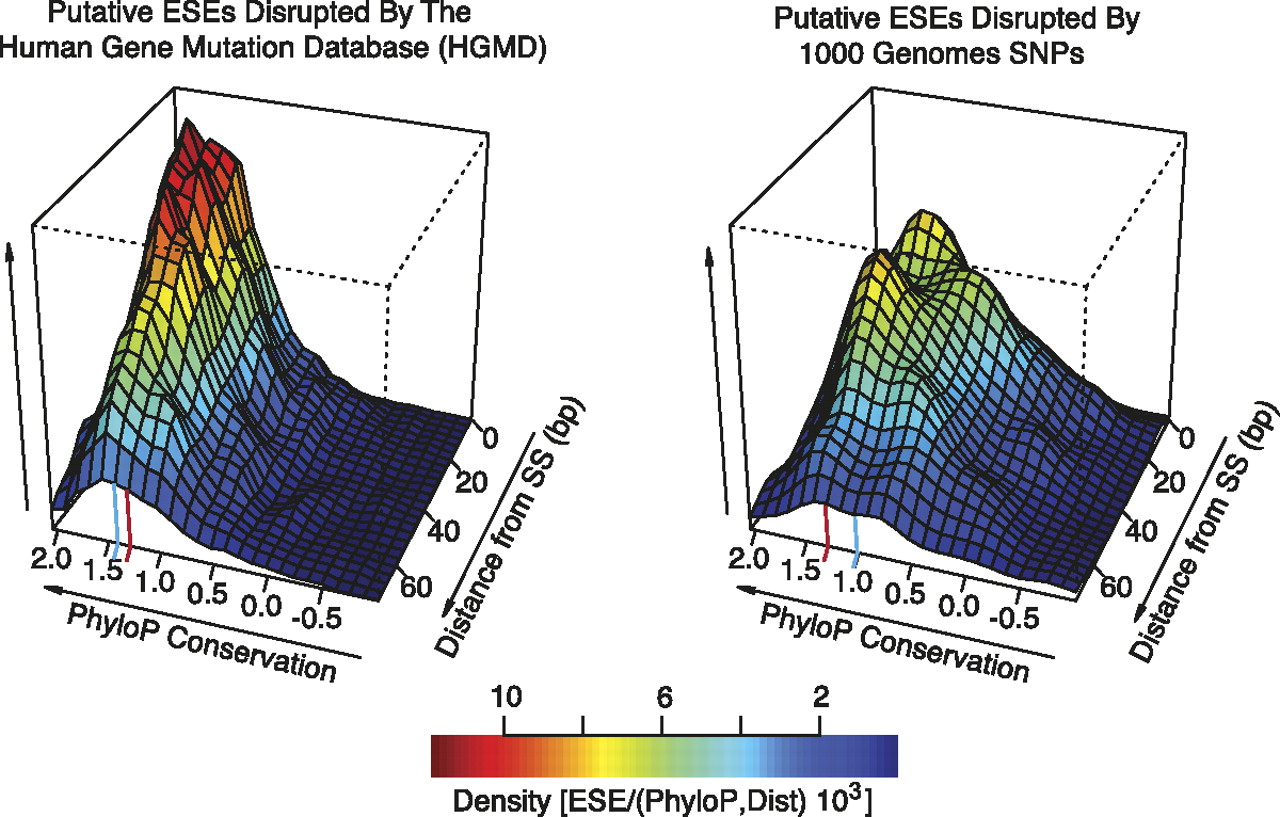
Figure 2.
Conservation of exonic splicing enhancers ablated by genomic variants. The two-dimensional density distributions (relative values given in color scale) of ESEs containing associated average phyloP (Pollard et al. 2009) scores and distances to the nearest splice site (3–72 bp). The density distributions for ESEs targeted for loss by inherited disease-causing (HGMD) mutations (left panel) or neutral SNPs (right panel). In each panel the red line designates a phyloP score corresponding to a P-value of 0.05. The blue line designates the median phyloP score of each density distribution.


