
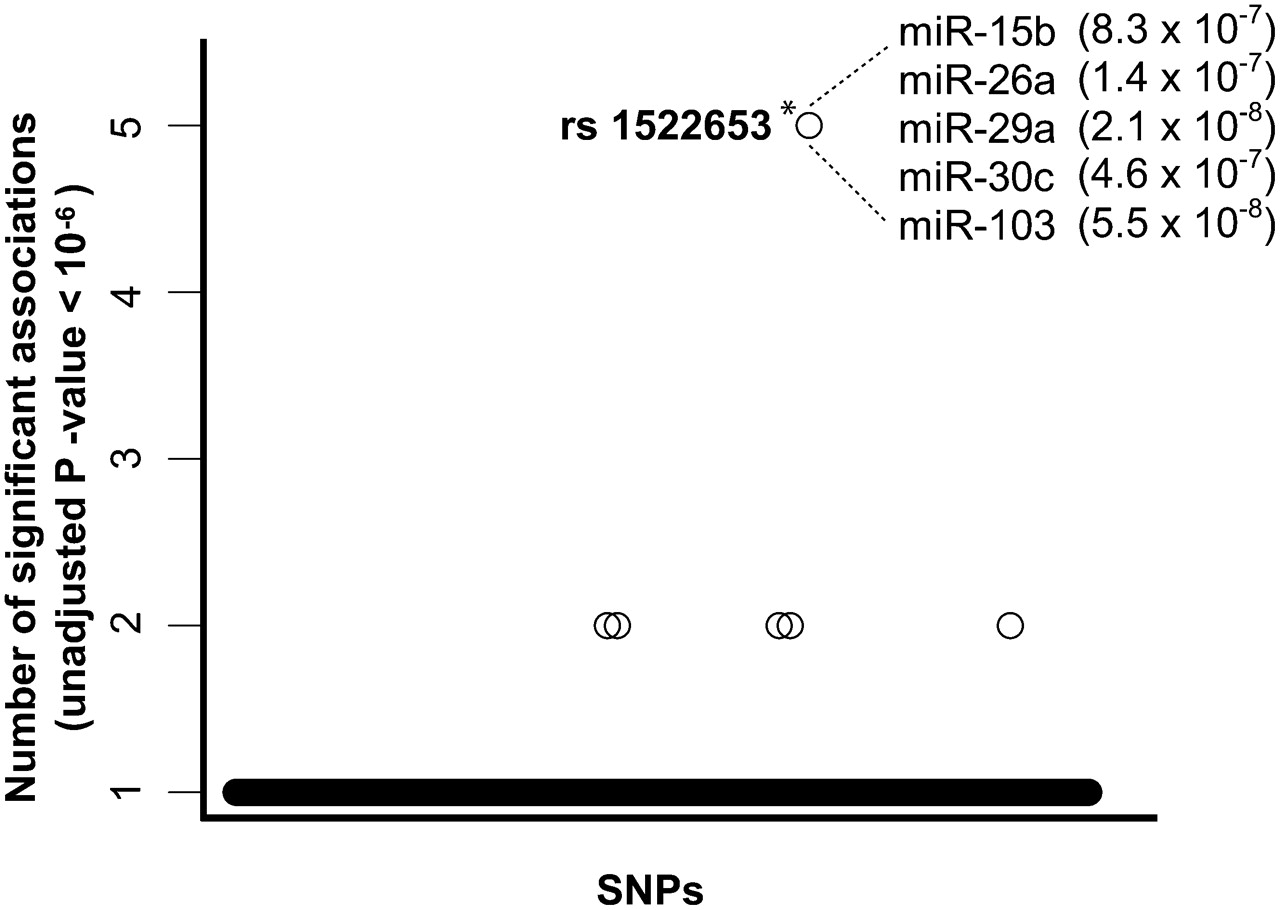
Figure 3.
Master miRNA trans-eQTLs. Plot shows SNPs associated with the expression variation of multiple miRNAs (using a threshold of an unadjusted P-value < 10−6 per association) (see Supplemental Table S2). Each circle represents a single SNP. Only SNPs with at least one association below the P < 10−6 threshold are shown. One SNP (rs1522653) is significantly associated with the expression of five miRNAs (*, permutated P-value of 0.005). The identities and unadjusted P-values for these miRNAs are shown.


