
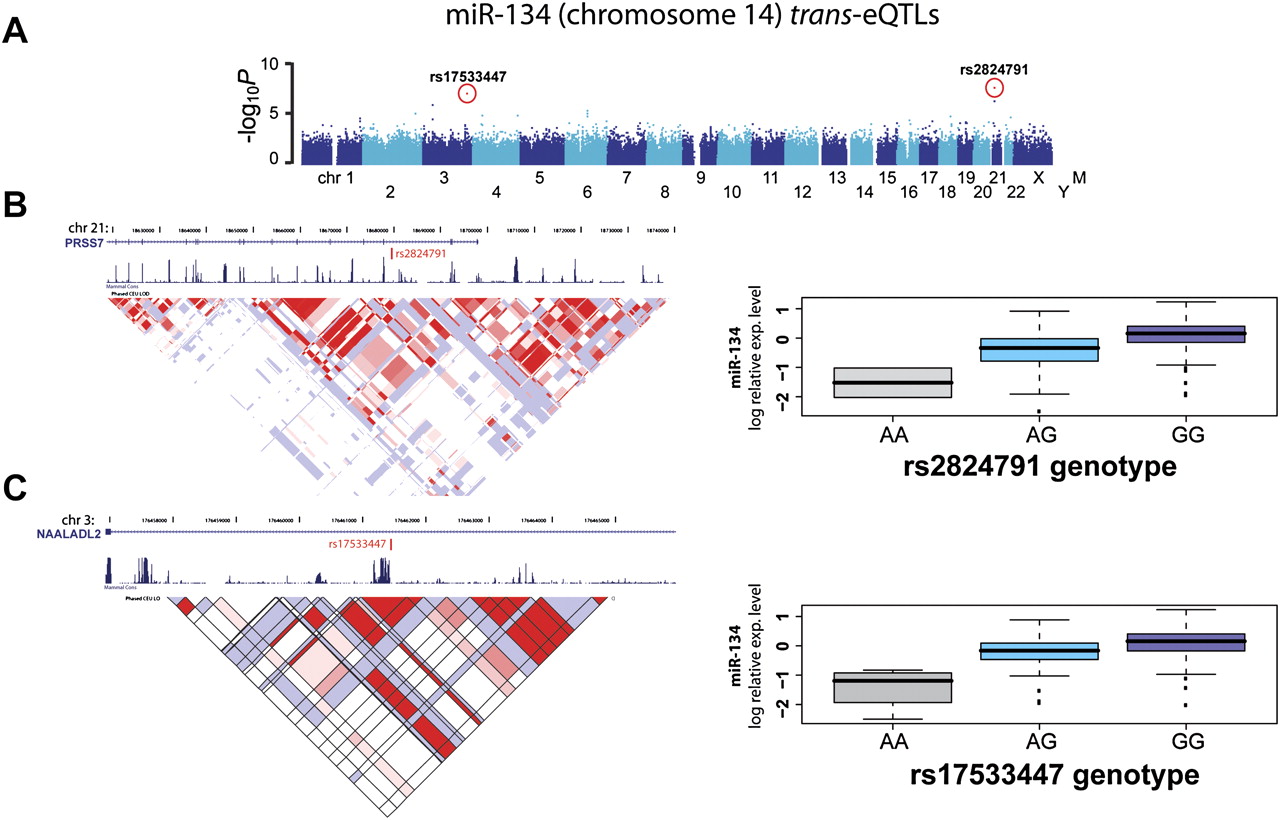
Example of trans- eQTLs for miR-134. (A) Manhattan plot displays −log10 P-values of a GWAS for miR-134 expression variation. Each chromosome is depicted as different shades of blue. Chromosome Y and mitochondrial genotypes have not been included in this study. Red dots indicate SNPs with the highest significant P-values after Bonferroni correction for multiple testing (see Table 1). Those two eQTLs, rs2824791 on chromosome 21 and rs7533447 on chromosome 3, are detailed in panels B and C, respectively. (B,C, left panels) The location of associated SNPs, as well as RefSeq transcripts, conservation, and LD information (LOD scores for CEU population). (B,C, right panels) Boxplots for miRNA expression for different genotypic groups.


