
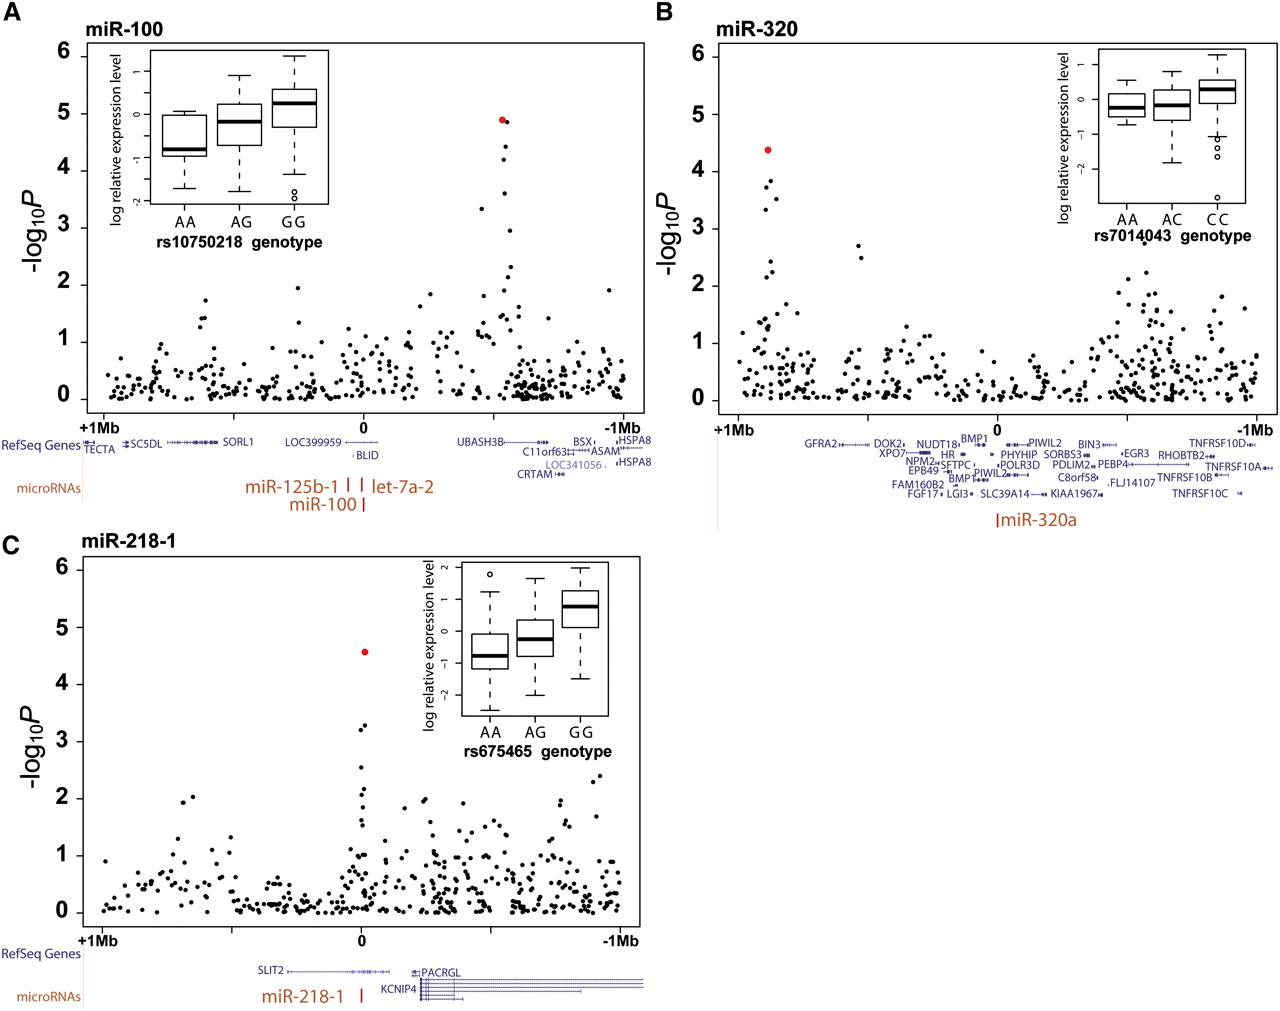
Figure 1.
Examples of cis-eQTLs for miR-100 (A), miR-320 (B), and miR-218-1 (C). The panels show the distribution of −log10 P-values for SNPs across a 1-Mb region surrounding the miRNA (“0” position). The highest significant −log10 P-values are shown as red dots. Also shown are the mapping of RefSeq genes in blue and miRNAs in red. The boxplots depict the relationship between miRNA relative expression levels (log2) and genotypes for the most significant SNPs. Boxplots are divided by median values.


