
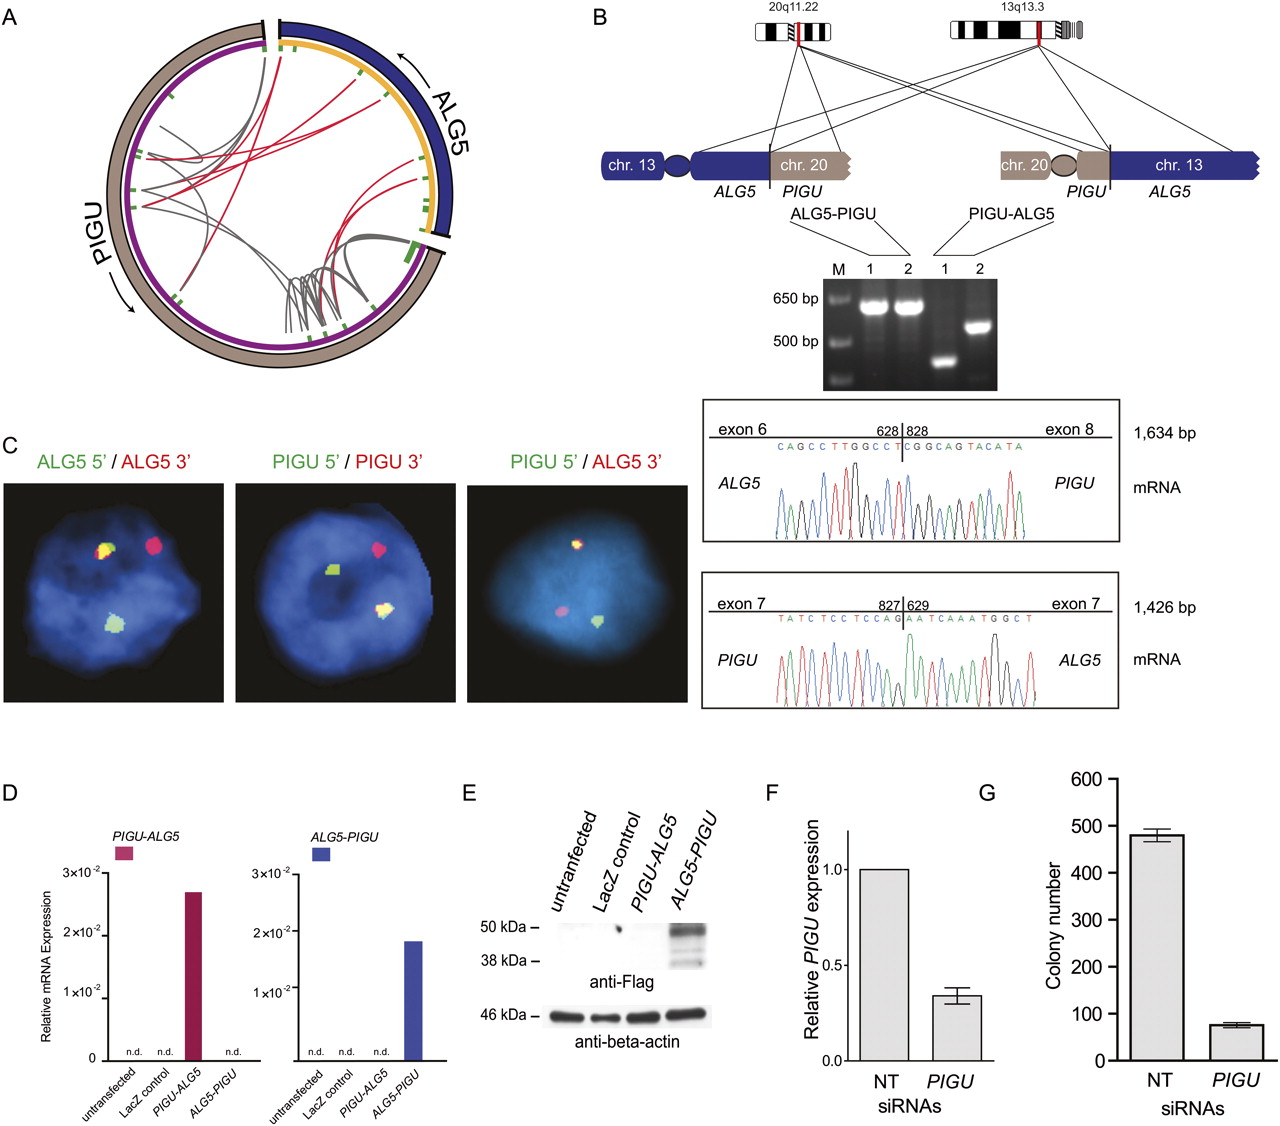
Characterization of the reciprocal balanced translocation event involving PIGU and ALG5. (A) Circos plot of ALG5–PIGU rearrangement. In the outer ring, (gray) chromosome 20 and (blue) chromosome 13. Genes are represented in purple (PIGU) and orange (ALG5) on the inner ring. Within the inner ring, each line denotes paired-end reads with either both ends mapping to PIGU (gray) or one end mapping to PIGU and the other end to ALG5 (red). The red lines connect 5′ ALG5 to 3′ PIGU and vice versa, thereby indicating a balanced translocation event. (B) Experimental validation of the two resulting gene fusions by RT-PCR and subsequent Sanger sequencing of the resulting PCR products. Two different primer pairs were used for verification of each gene fusion transcript indicated as 1 and 2. (C) FISH validation of the ALG5–PIGU fusion in the index case by break-apart assays (left and middle) and a fusion assay (right). (D) Expression of ALG5–PIGU and PIGU–ALG5 messages, as determined by quantitative PCR following transfection of the indicated constructs in HEK293 cells. (E) Immunoblot analysis on the transfected HEK293 cells showing protein expression only in ALG5–PIGU transfected cells. (F,G) LNCaP cells were treated with nontargeting (NT) siRNAs or siRNAs against PIGU to assay for effect of anchorage-independent growth in soft agar. (F) Bar graph showing expression of PIGU after siRNA treatment. (G) LNCaP cells treated with PIGU siRNAs show reduced colony formation ability.


