
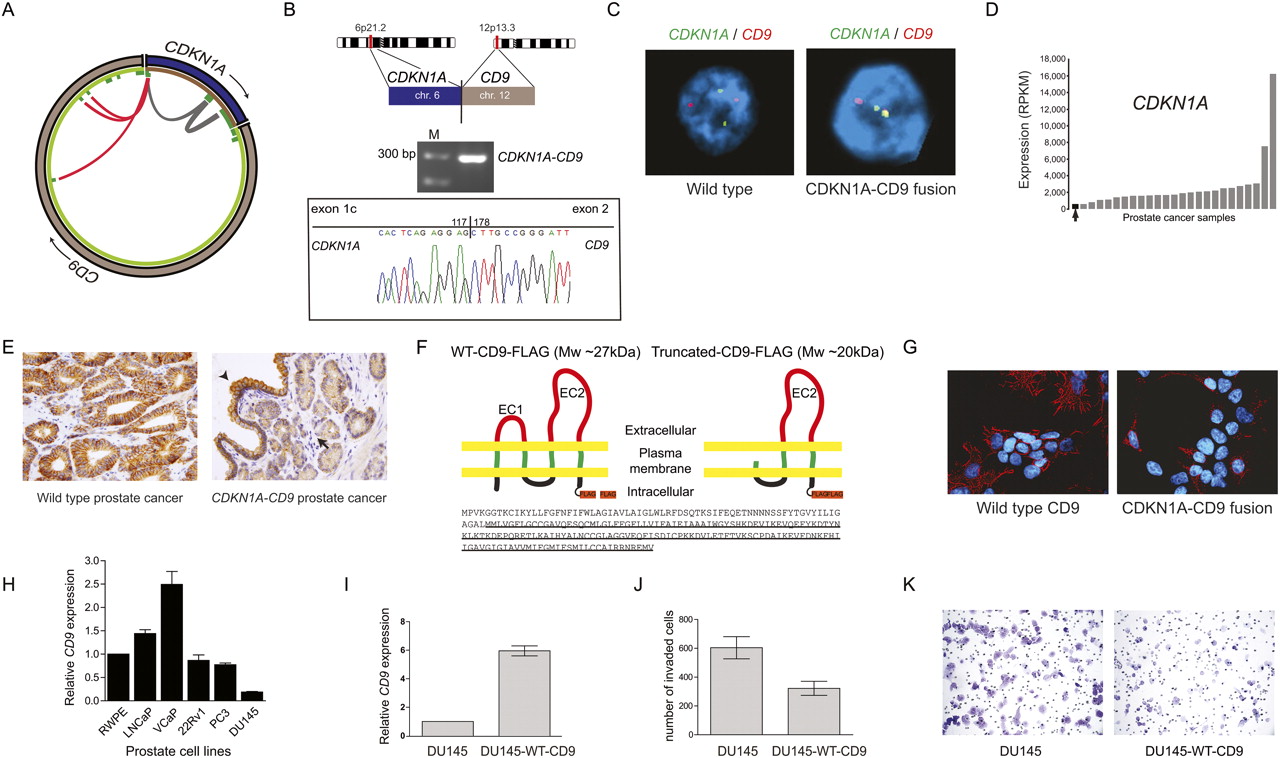
Characterization of the CDKN1A–CD9 gene fusion candidate. (A) Mapping of PE RNA-seq reads to CDKN1A with either both ends mapping to CDKN1A (gray) or one end mapping to CD9 (red) and thereby connecting CDKN1A exon 1 to 3′ exons of CD9. (B) Experimental validation of the gene fusion transcript by RT-PCR and subsequent Sanger sequencing. (C) FISH validation of the CDKN1A–CD9 fusion in the index case (right) but not in another control cancer (left). (D) The fusion positive prostate cancer sample (black) has the lowest CDKN1A expression levels across 25 prostate cancers. Expression levels are indicated in reads per kilobase of exon model per million mapped reads (RPKM) as defined previously (Mortazavi et al. 2008). (E) Immunodetection of CD9 by immunohistochemistry. (Left) Strong CD9 membranous expression detected in malignant glands from a prostate cancer sample without a detectable CD9 rearrangement. (Right) Malignant glands in CDKN1A–CD9 fusion positive case (arrow) showing weak membranous expression in comparison to adjacent benign areas (arrowhead). (F) Schematic illustration of Flag-tagged WT–CD9 and Flag-tagged CDKN1A–CD9 fusion protein. The fusion event leads to a truncated CD9 protein with loss of two transmembrane domains and the small extracellular domain (EC1). (Bottom) The amino acid sequence of WT–CD9 protein with the truncated CD9 protein version underlined. (G) Immunofluorescence staining revealed the expression of WT–CD9 and truncated CD9 in HEK293 cells stained with anti-Flag (red) antibody. Nuclei were stained with DAPI (blue). (H) Expression levels of CD9 mRNA transcripts in prostate cell lines. (I) CD9 expression from control or stably CD9-expressing DU145 cells. (J) Bar graph comparing the invasiveness of the two lines as assessed by Boyden chamber assays. (K) Representative images of invaded cells for each cell line.


