
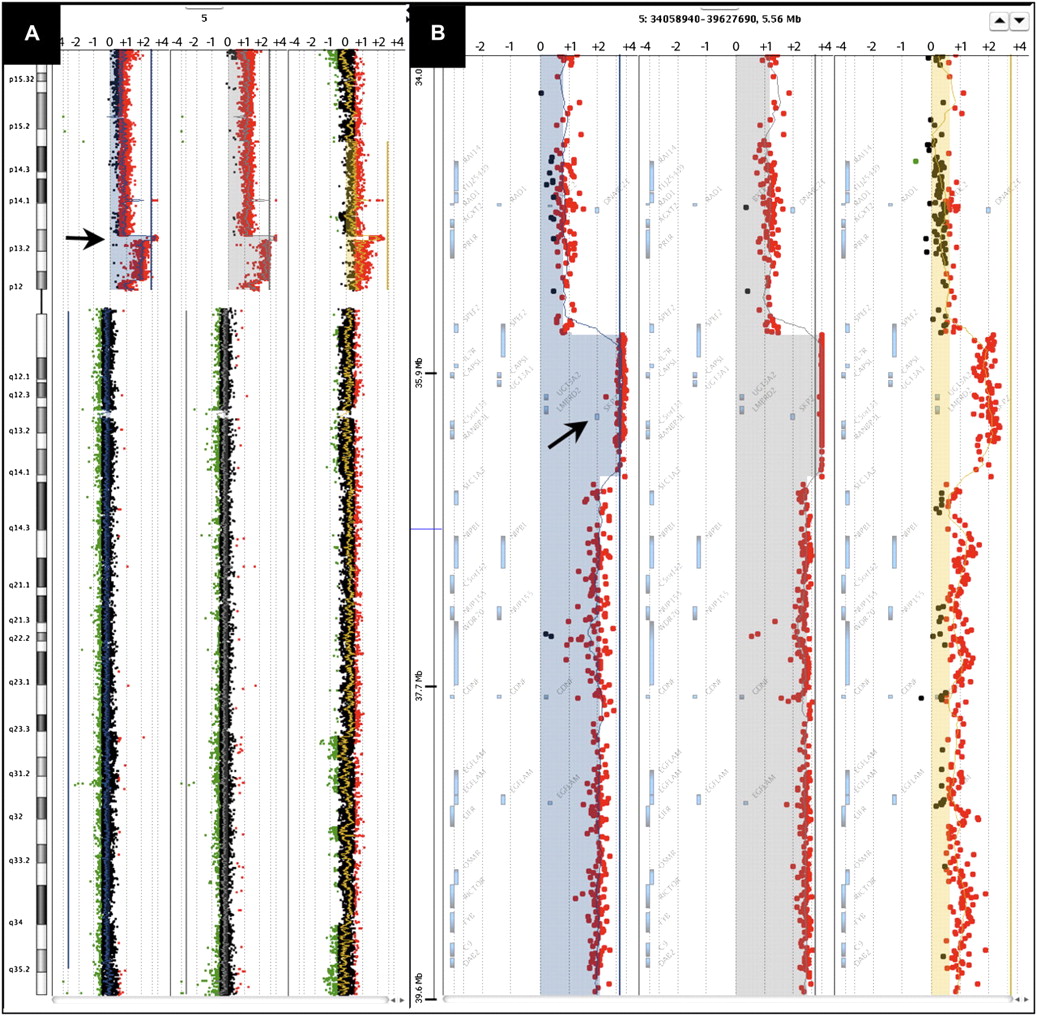
Figure 2.
Illustration of high-level amplification at 5p13.2 in tumors from patient RA45. (A) Chromosome view in Agilent DNA Analytics software showing log2 ratios for probes mapping along chromosome 5 for RA45M (left), RA45RM (middle), and RA45AT (right). Amplicon at 5p13.2 is depicted by the arrow. (B) Gene view in DNA Analytics showing log2 ratios for probes mapping to 5p13.2 for RA45M (left), RA45RM (middle), and RA45AT (right). Arrow points to map position of the SKP2 gene locus.


