
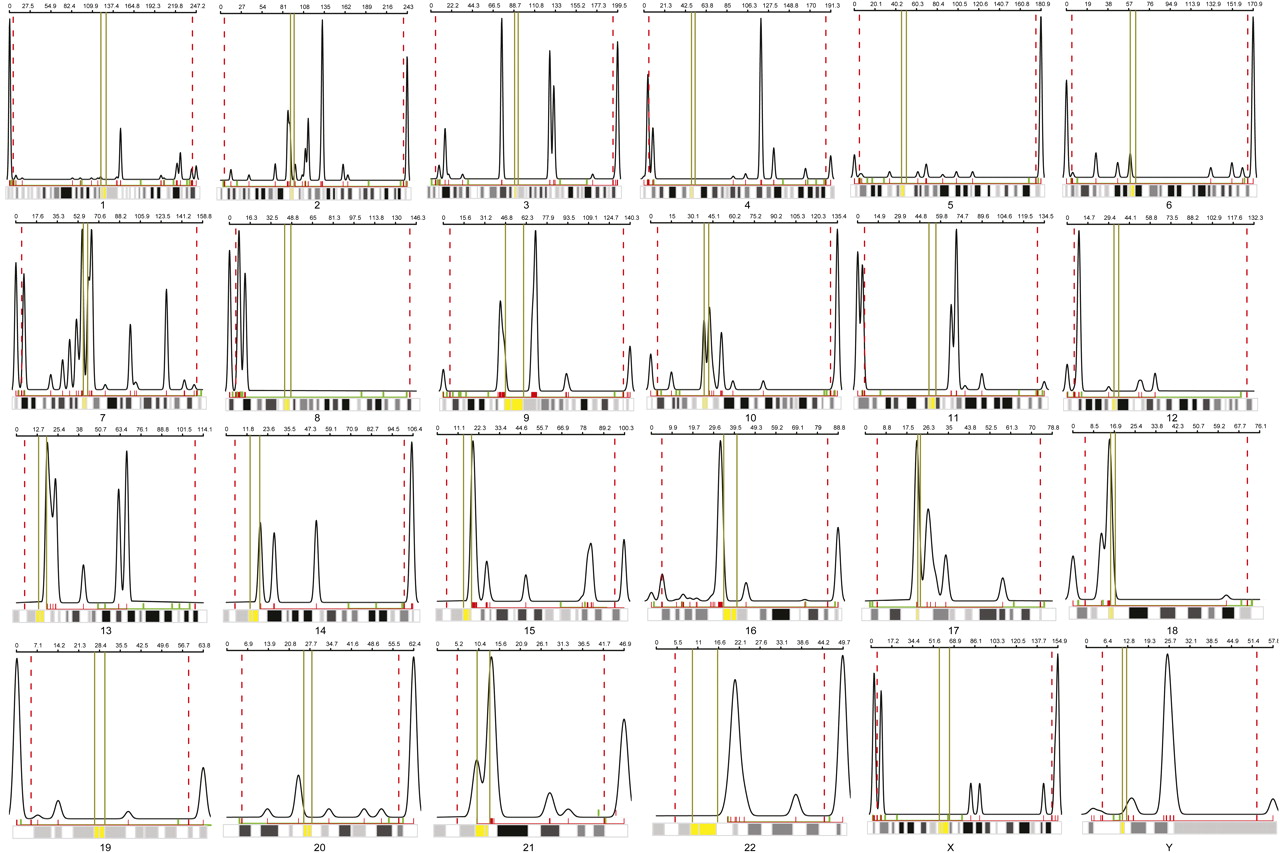
Figure 6.
The distributions of 1143 LCR potential substrate pairs with relation to chromosome position. For each chromosome, the distribution of the LCR (x-axis) is plotted against the frequency of the LCR (y-axis) along the entire chromosome. The red dotted vertical lines on both ends of the chromosome represent the first and last 5 Mb of each chromosome; the yellow line represents the centromeric region as aligned with the karyogram on the bottom of each graphic. The red hash marks underneath the plots depict the density of the LCRs, while the green bar represents the distribution of the 170 breakpoint regions from our genome-wide unbalanced translocation data.


