
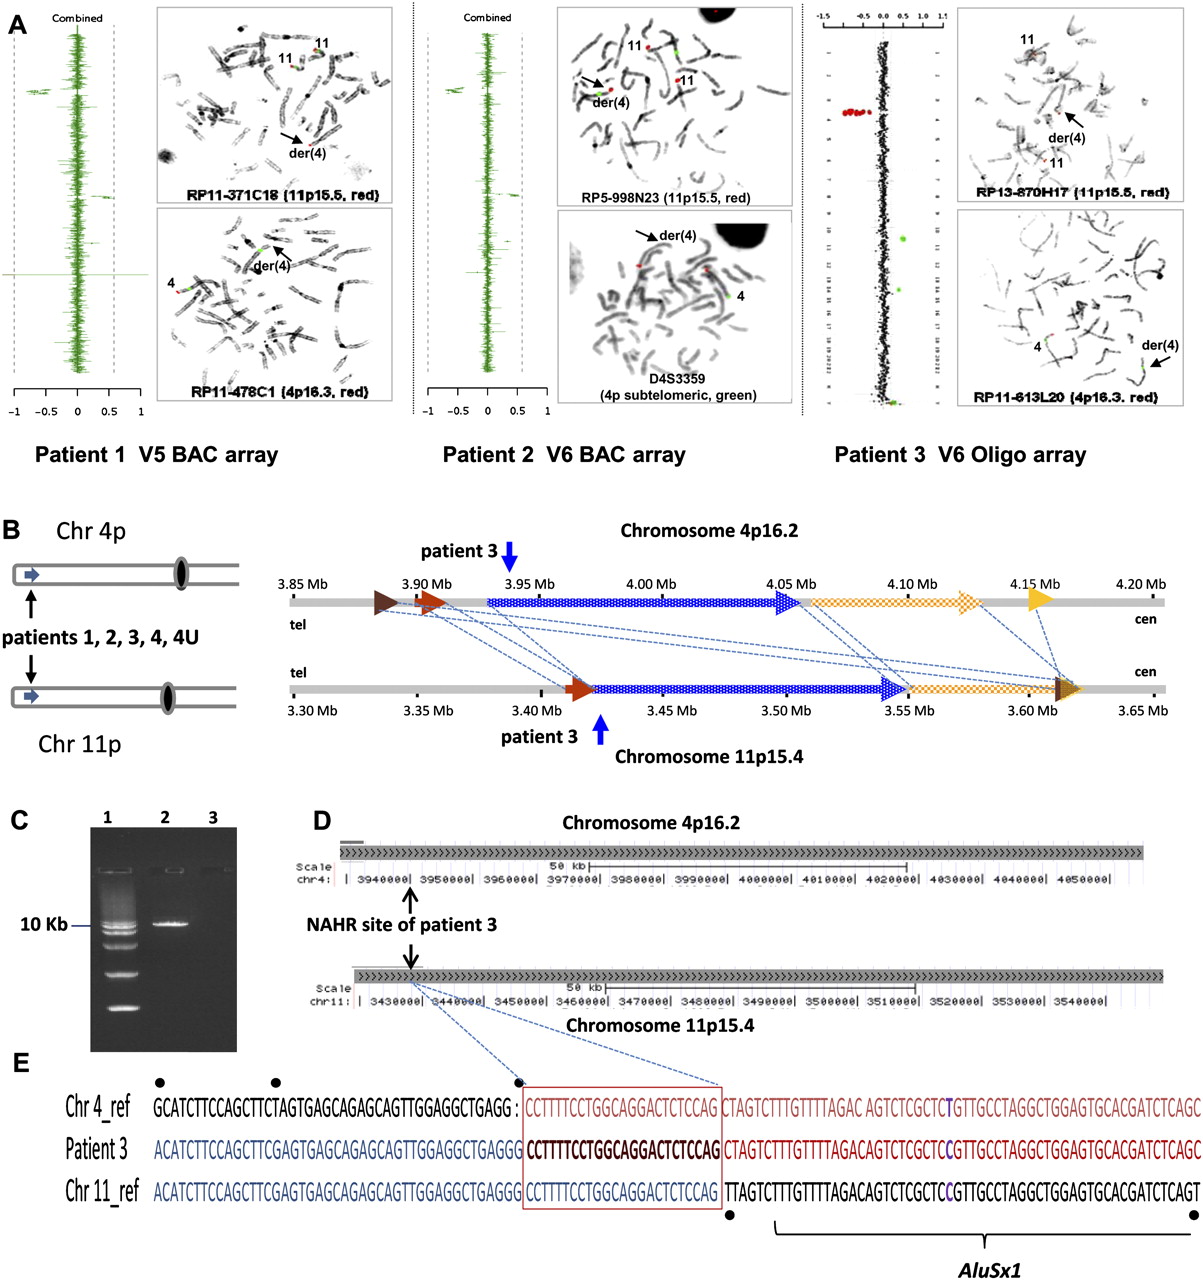
Identification of the LCR pairs acting as potential substrates for interchromosomal NAHR, resulting in the t(4;11) formation. (A) CMA profile of DNA from patient 1 (left). The mean normalized log2 (Cy3/Cy5) ratio of each BAC clone is plotted on the x-axis as dots with error bars, and arranged along the vertical axis from chromosome 1 at the top to chromosomes X and Y at the bottom. All 11 clones on the 4p subtelomeric region showed displacement to the left, indicating a deletion of 4p16.2-p16.3 material, whereas five clones on the 11p subtelomeric region are shifted to the right, indicating a duplication of 11p15.5 material in the patient versus the reference DNA. The results of FISH analysis of metaphase chromosomes prepared from the patient's peripheral blood lymphocytes with probe RP11-371C18 specific for chromosome region 11p15.5 (red) show the presence of 11p15.5 material on the derivative chromosome 4 [der(4)] (arrow), whereas the results of FISH analysis with probe RP11-478C1 specific for chromosome region 4p16.3 (red) show the deletion of 4p16.3 material (arrow). The CMA and FISH analyses revealed an unbalanced translocation between 4p16 and 11p15. CMA profile of DNA from patient 2 tested on V5 BAC array (middle). As in patient 1, the 4p deletion and 11p duplication were detected by displacement of 11 clones and five clones on the corresponding region, respectively. The results of FISH analysis with the PAC probe RP5-998N23 (red) specific for 11p15.5 indicate the presence of 11p15.5 material on der(4), whereas the results of FISH analysis in patient 2 with the 4p subtelomeric probe D4S3359 (green) show the deletion of 4pter material. CMA profile of DNA from patient 3 tested on BAC emulated Version 6 OLIGO array (right) revealed the same genomic aberrations as patients 1 and 2. The results of FISH analysis with RP13-870H17 (red) specific for 11p15.5 indicate the presence of 11p15.5 material on der(4), whereas FISH analysis for patient 2 with probe RP11-613L20 specific for chromosome region 4p16.3 (red) show the deletion of 4p16.3 material. (B) Five t(4;11) cases mapped this to NAHR substrate pair. Summary of the sequence similarity BLAST2 analysis of the 350-kb sequence surrounding the 4p16.2 (top) and 11p15.4 (bottom) breakpoint regions. The different color horizontal arrows depict the homologous LCR subunits. The numbers above and below the lines represent genomic distance (megabases) from 4p and 11p telomeres, according to NCBI human genome build 37 (GRCh37/hg19; Feb. 2009). The regions between 4p16.2 and 11p15.4 connected by dotted lines are >94% sequence identical. The translocation breakpoints in patient 3 are located in the homologous LCRs indicated by the vertical arrows, implying a NAHR-based recombination mechanism. (C) Ethidium bromide stained agarose gel image of the ∼9-kb t(4;11) patient 3-specific junction fragment amplified by long-range PCR with primers harboring trans-morphisms specific for each 4p16.2 and 11p15.4 LCR (lane 2). Lane 1 represents the DNA marker with the 10-kb band indicated to the left. Lane 3 represents a negative control. (D) The NAHR cross-over site for patient 3 is located in a 130-kb subunit with 94.7% DNA sequence identity. UCSC Genome Browser view of the homologous LCR blocks of the same orientation in the chromosome regions 4p16.2 (top) and 11p15.4 (bottom) indicated by the gray bars. The black arrows indicate the NAHR site for patient 3 determined by sequence analysis. (E) DNA sequence alignment of the PCR amplified translocation junction fragment in patient 3 (middle sequence). The NAHR site was narrowed to a 24-bp segment (red rectangle) with 100% DNA sequence identity between chromosomes 4 (top) and 11 (bottom). Blue nucleotides indicate alignment with the chromosome 11 sequence, red nucleotides indicates alignment with the chromosome 4 sequence, purple nucleotides indicate SNPs, and trans-morphic mismatches are indicated by black dots above or below the sequence.


