
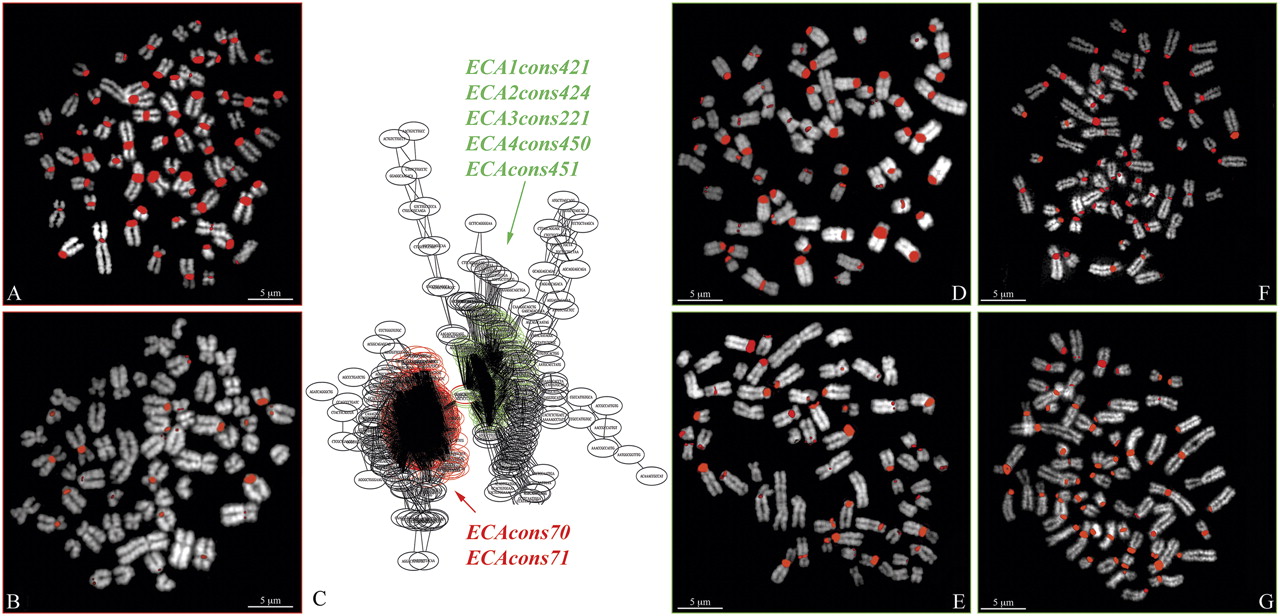
Figure 2.
Example of FISH results on ECA metaphase spreads using horse PCR products obtained with primers designed on ECA consensus sequences (Table 1). Partial RepeatNet graph is reported in C showing two different clusters colored in red and green, respectively. ECAcons70 and ECAcons71 were extracted from the red cluster, while ECA1cons421, ECA2cons424, ECA3cons221, ECA4cons450, and ECA5cons451 were obtained from the green cluster. (A) FISH with PCR product of ECAcons70. (B) FISH with PCR product of ECAcons71. (D) FISH with PCR product of ECAcons421 + 424. (E) FISH with PCR product of ECA3cons221. (F) FISH with PCR product of ECA4cons450. (G) FISH with PCR product of ECA5cons451.


