
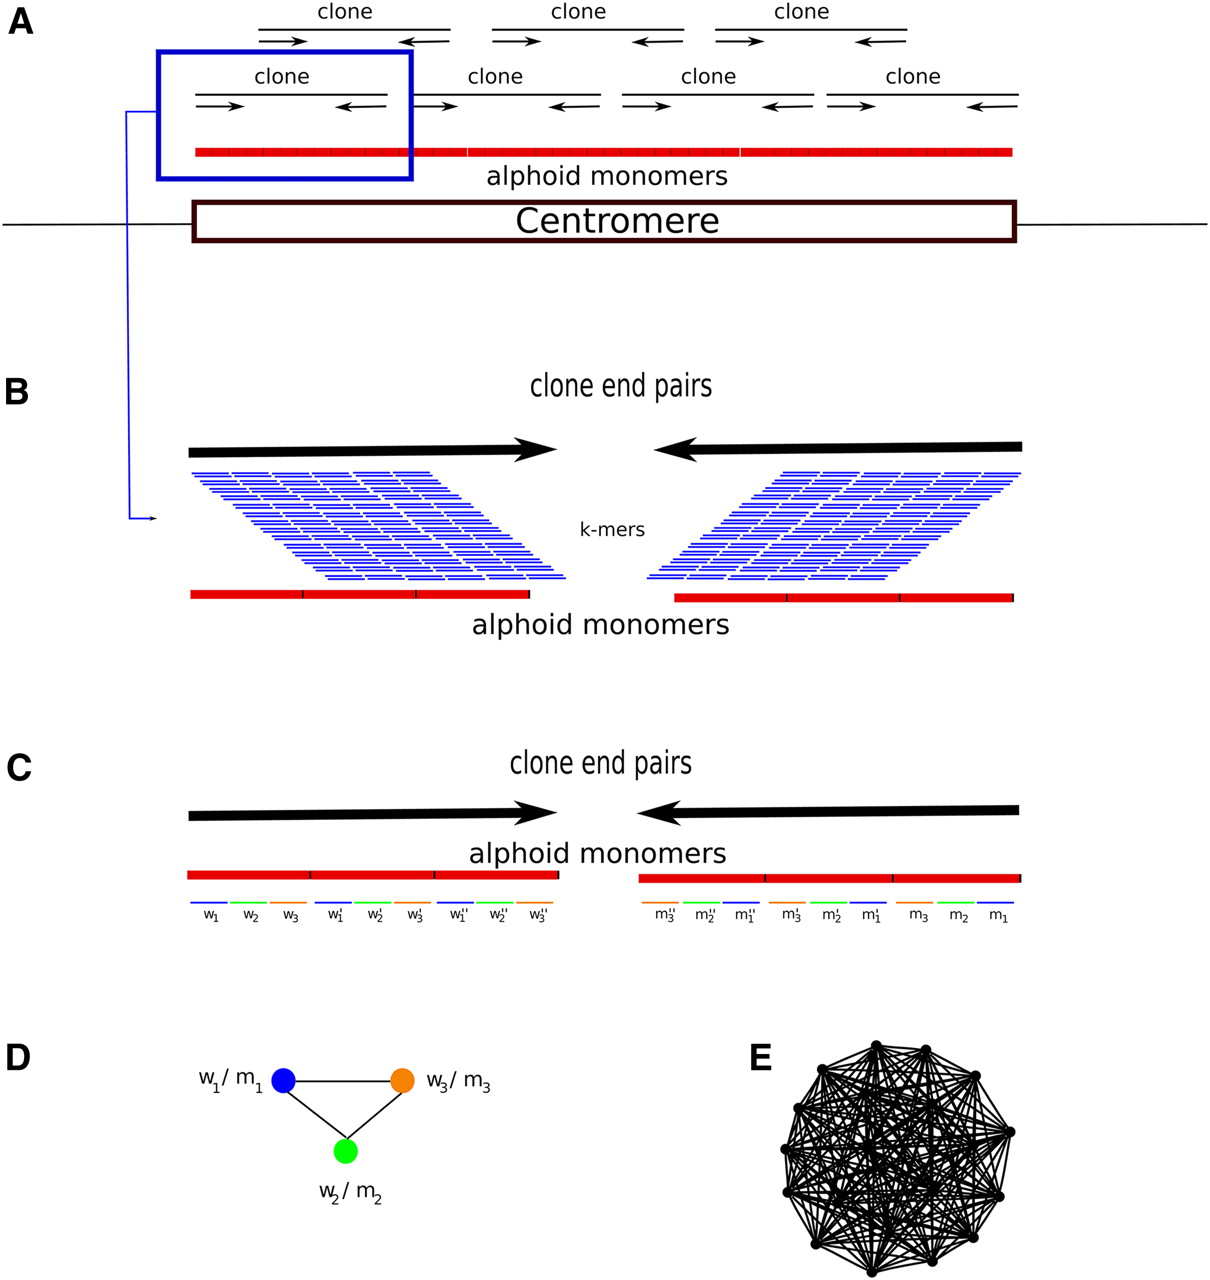
The RepeatNet algorithm. (A) The layout of the alphoid repeat array in the centromere and the paired-end inserts in the centromeric region is shown. Note that since the centromere is larger than the inserts (fosmids, plasmids, BACs, or short inserts used in next-generation sequencing), both ends of the same insert contain alphoid sequence. (B) Close-up view of a paired-end insert over the alphoid repeat array. We also show all possible k-mers (sliding by 1 bp) that can be generated from the reads. (C) The ideal case for the k-mer structure in the end sequences. When both ends of a paired-end insert contain alphoid sequence, we expect that the k-mers in the forward end will be represented with their reverse-complement counterparts in the reverse end. For simplicity, we show only the nonoverlapping k-mers; however, RepeatNet considers all possible overlapping k-mers. In this figure, w1-m1, w2-m2, w3-m3, w′1-m′1, w′2-m′2, w′3-m′3, w′′1-m′′1, w′′2-m′′2, w′′3-m′′3 are the k-mer pairs that are reverse complements of each other, and the triplet k-mer groups (w1-w′1-w′′1), (w2-w′2-w′′2), (w3-w′3-w′′3) are highly similar k-mers. In the case of exact repeats, these k-mers are identical. (D) Since k-mer pairs w1-m1, w2-m2, and w3-m3 exist in the same read pairs, we put an edge between the nodes that represent such k-mers. (E) The repeat graph for the ideal case of a 31-mer tandem repeat with exact repeat units is shown. This graph includes 20 vertices for 20 k-mer pairs that can be generated from a 31-mer repeat structure, and there exists an edge between all pairs of k-mers. Note that this graph is a clique of size 20. For non-ideal cases, the clique property will be lost; however, the graph will still be very dense in terms of the average degree of the vertices. RepeatNet finds such dense subgraphs of the repeat graph with a heuristic that selects the vertex with the highest degree, and other vertices that share an edge with this selected vertex. Alternatively, a maximum density subgraph algorithm can be used (Fratkin et al. 2006), though this algorithm has a high running time complexity of O[n.m.log(n2m)].


