
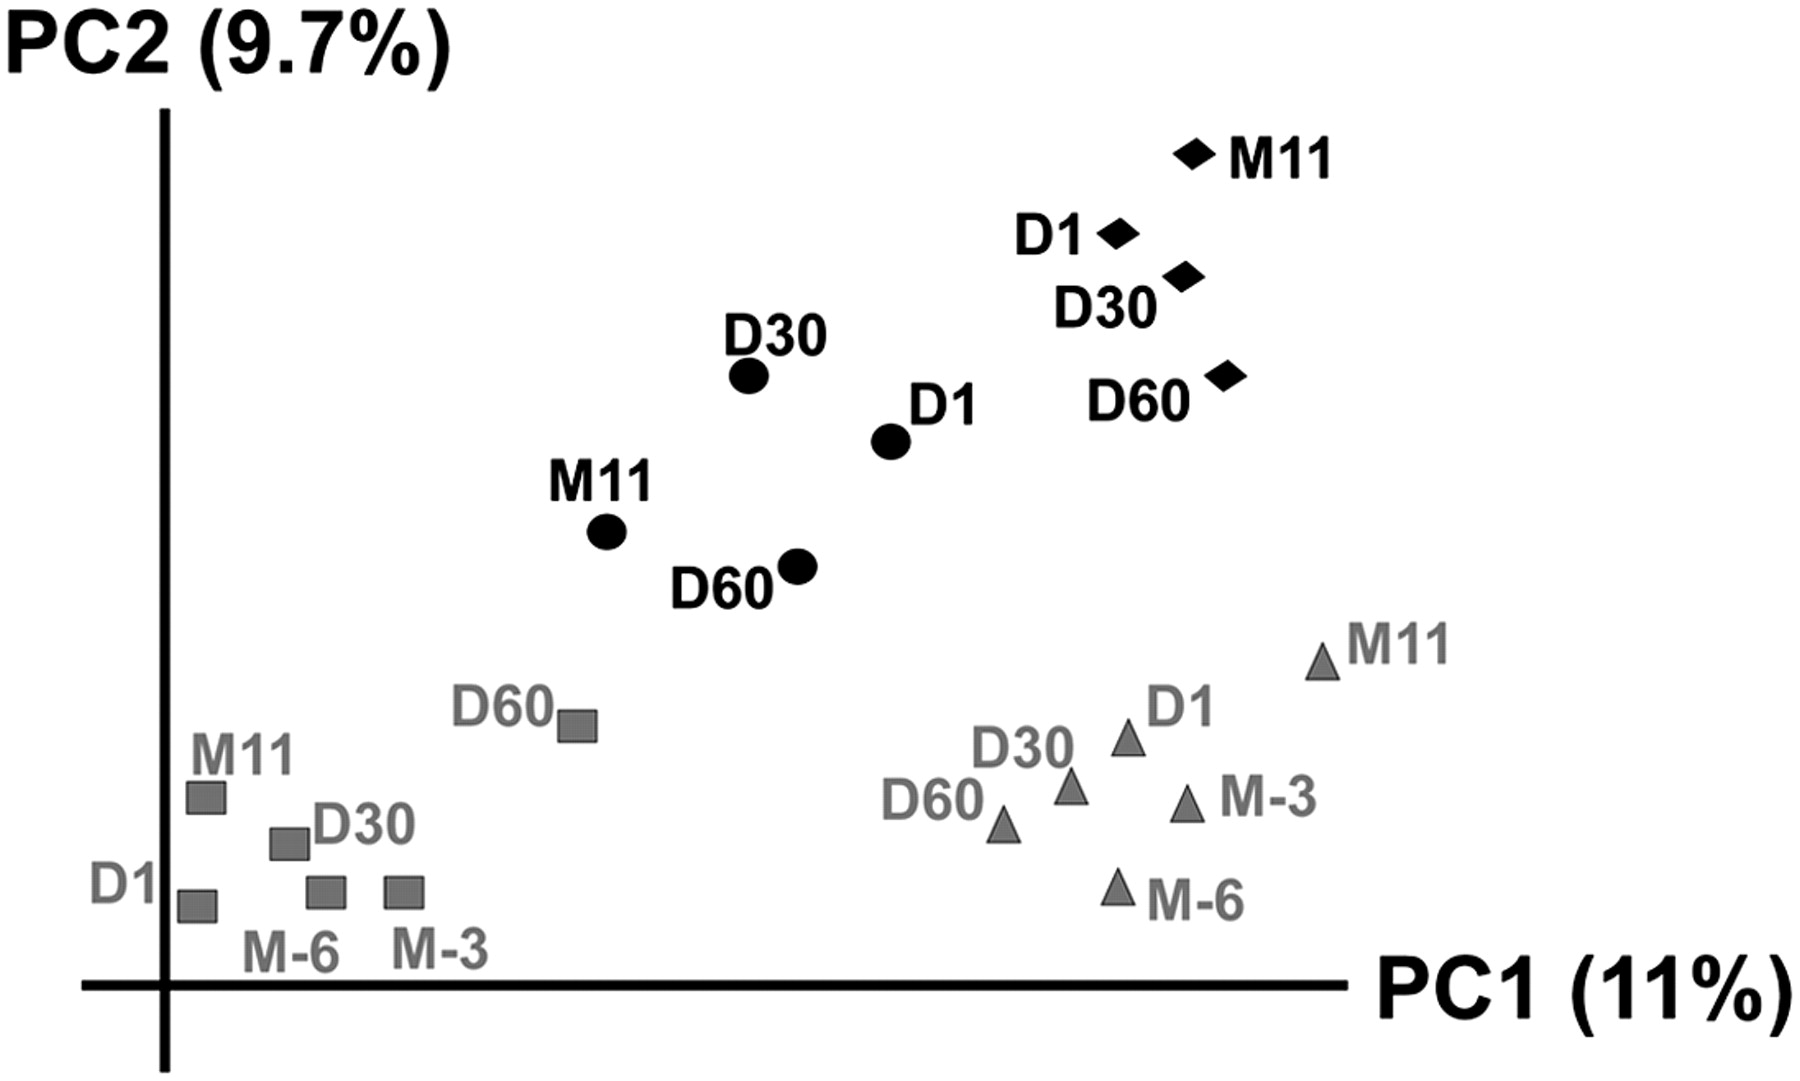
Figure 6.
Principal coordinates analysis of OTU composition based on 16S rRNA gene sequence data from the saliva of each subject. Input to the analysis was beta unweighted unifrac distances. (Gray triangles) Subject #1; (gray squares) subject #2; (black circles) subject #3; (black diamonds) subject #4.


