
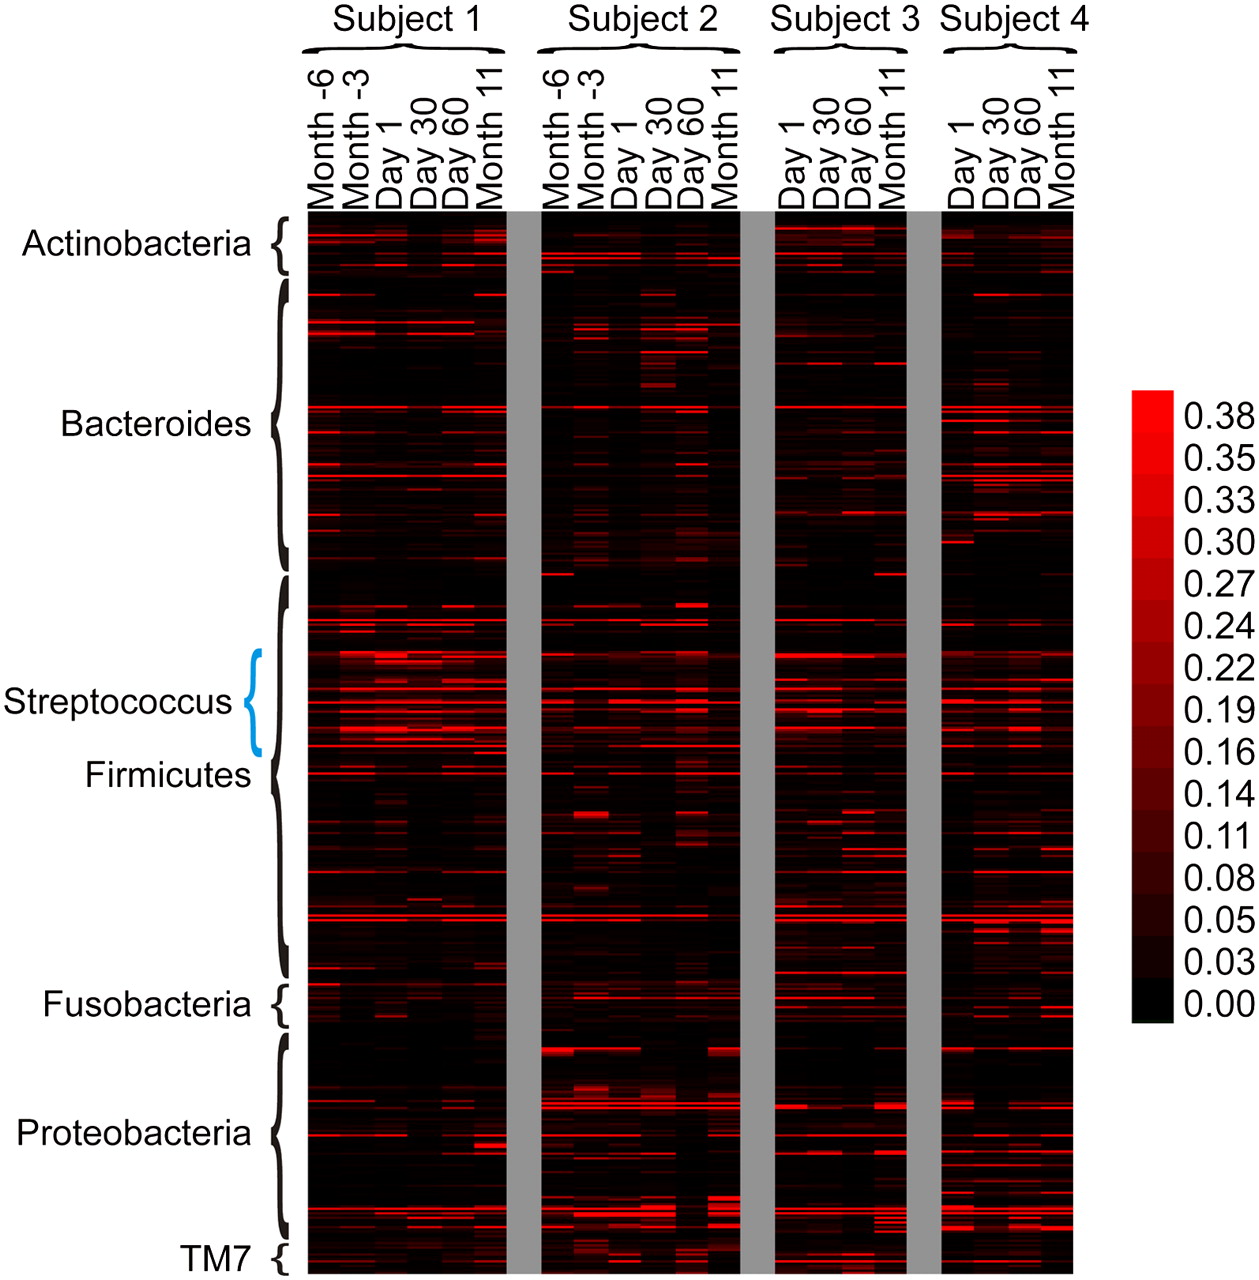
Figure 5.
Heatmap of bacterial OTU abundance based on analysis of 16S rRNA gene sequences from each of the samples and subjects. OTUs were determined by phylogenetic analysis of 16S rRNA sequence alignments, using a 97% cutoff value. Each row represents a unique OTU sequence based on the cutoff criterion. The intensity scale bar is located to the right. Taxonomic labels are shown along the y-axis, with OTUs from the genus Streptococcus indicated with a blue brace.


