
Figure 2.
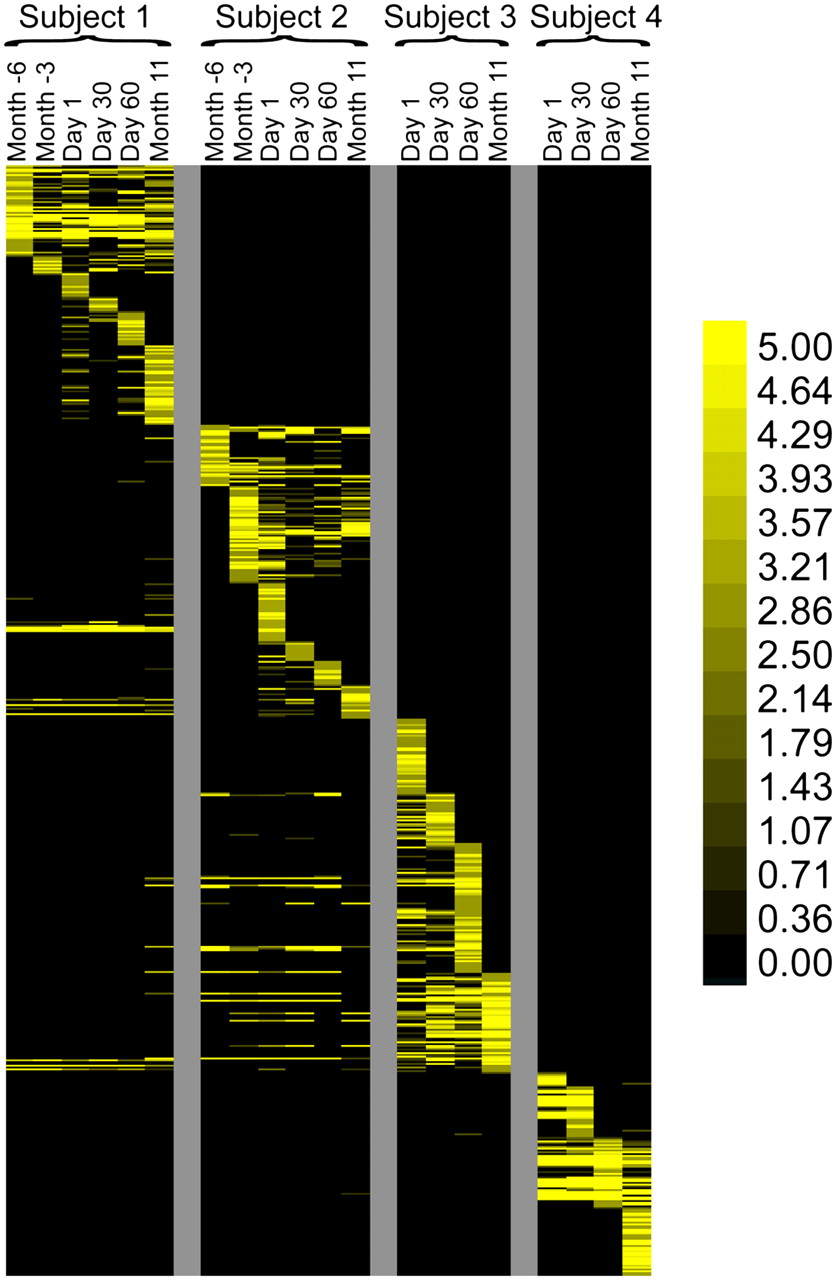
Heatmap of unique spacers present in each subject at all time points. Each row represents a unique spacer sequence. The intensity scale bar is located to the right.
(Downloading may take up to 30 seconds. If the slide opens in your browser, select File -> Save As to save it.)
Click on image to view larger version.
Heatmap of unique spacers present in each subject at all time points. Each row represents a unique spacer sequence. The intensity scale bar is located to the right.
 CiteULike
 Delicious
 Digg
Digg Facebook
 Google+
 Reddit
 Twitter
