
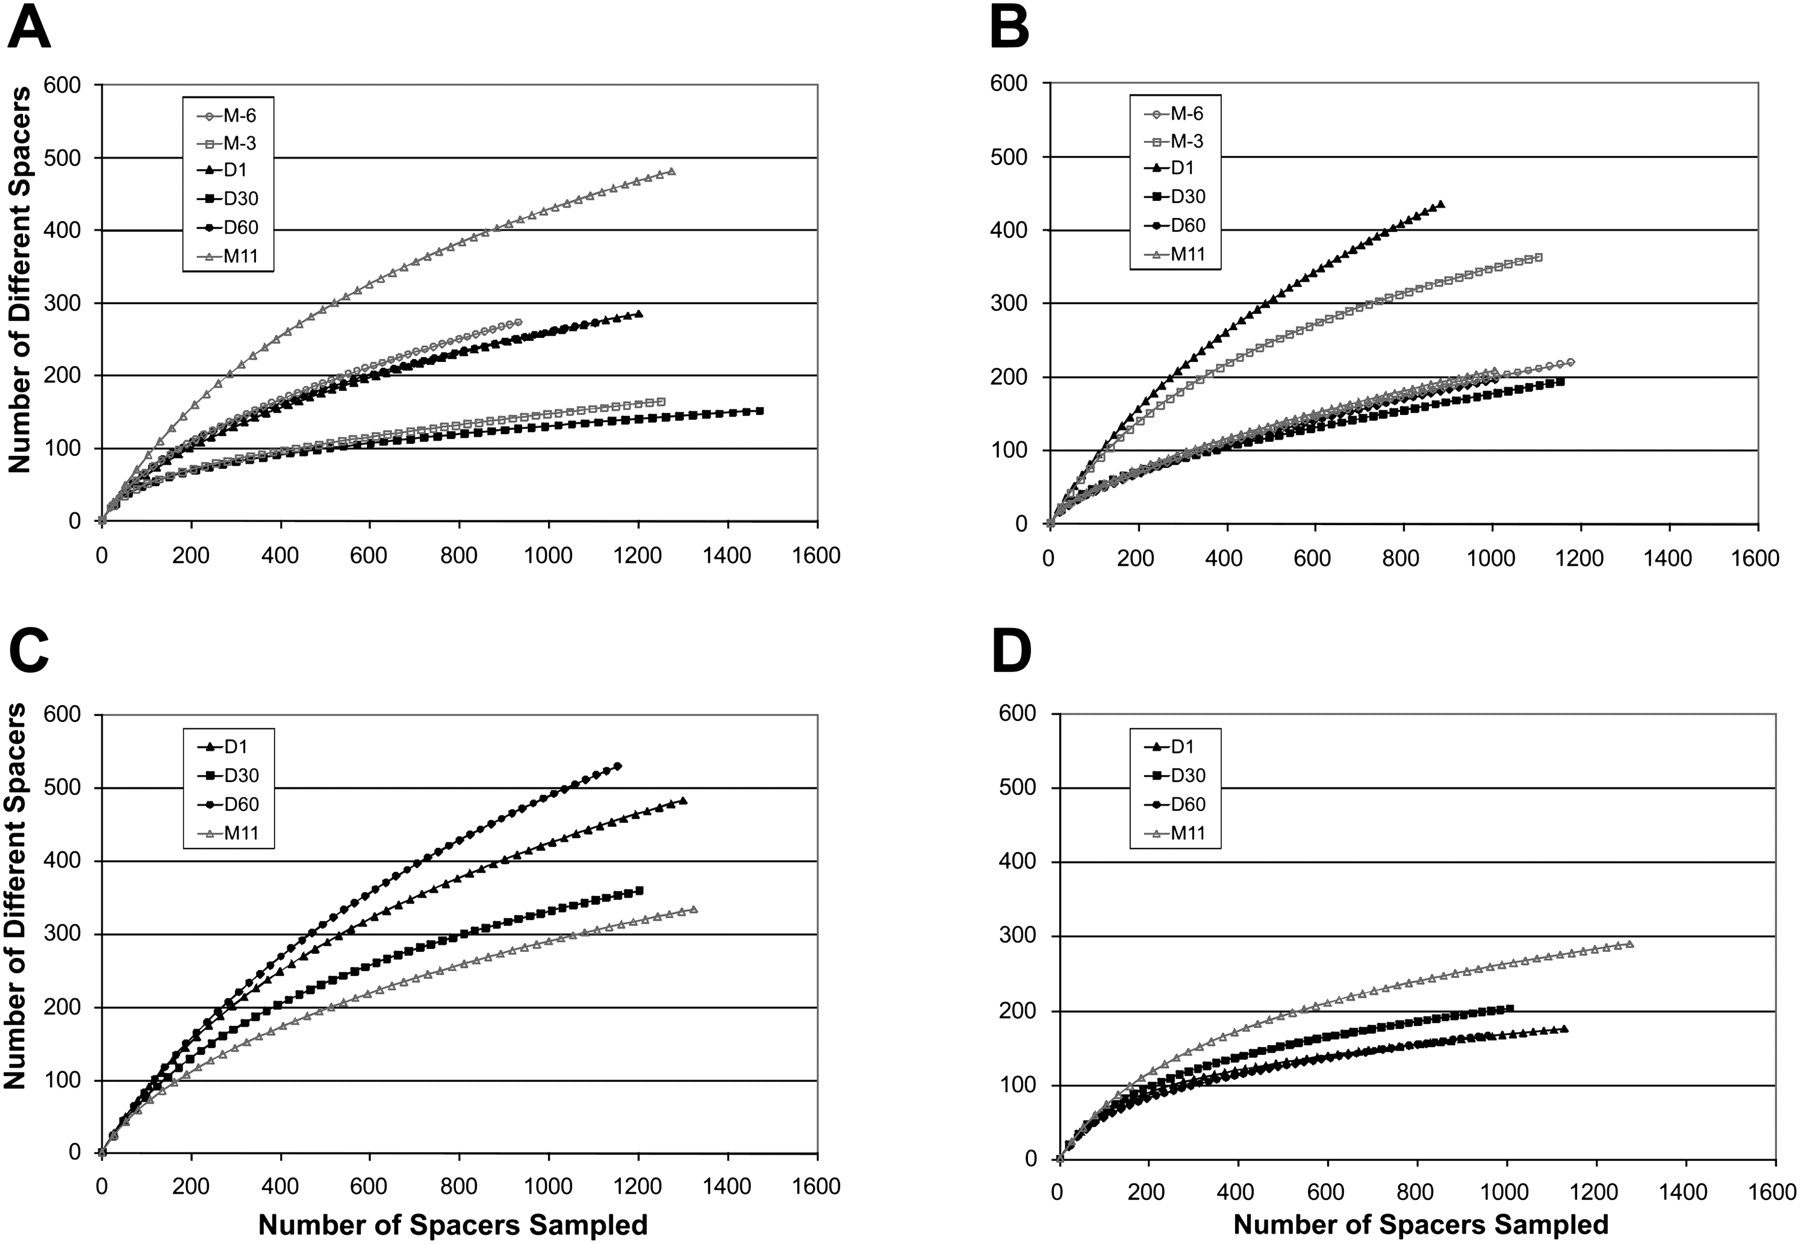
Figure 1.
Rarefaction analysis of CRISPR spacers in the saliva of human subjects at each sampled time point. Rarefaction curves were created using 10,000 random iterations based on spacer richness. (A) Subject #1; (B) subject #2; (C) subject #3; (D) subject #4. (Open circle) Month −6; (open square) Month −3; (closed triangle) Day 1; (closed square) Day 30; (closed circle) Day 60; (open triangle) Month 11.


