
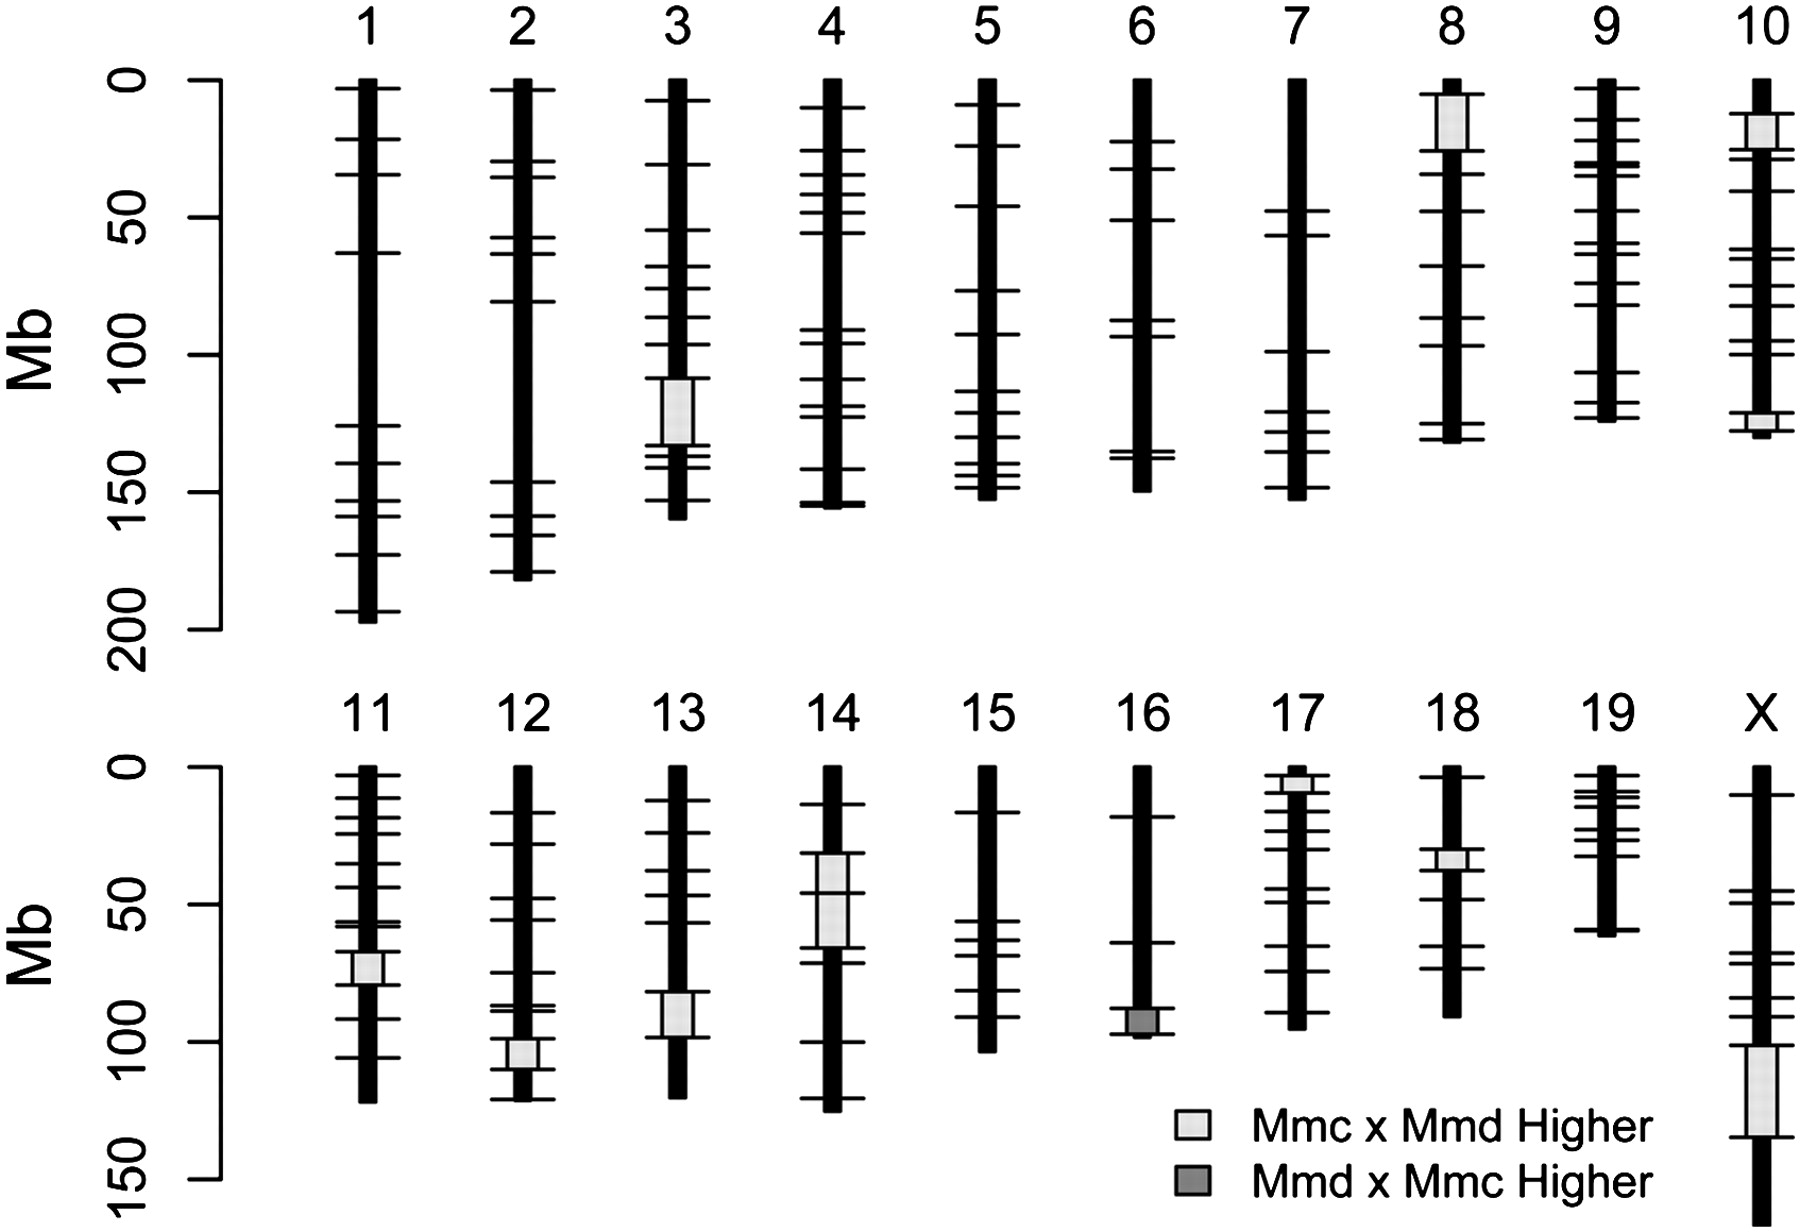
Figure 4.
Intervals with significant genetic map length differences between reciprocal crosses of Mmd and Mmc are plotted on the physical mouse genome. (Black horizontal lines) The positions of genotyped loci; (light gray boxes) regions with significantly longer map length in the Mmc × Mmd cross; (dark gray boxes) genomic intervals with significantly longer map lengths in the Mmd × Mmc cross.


