
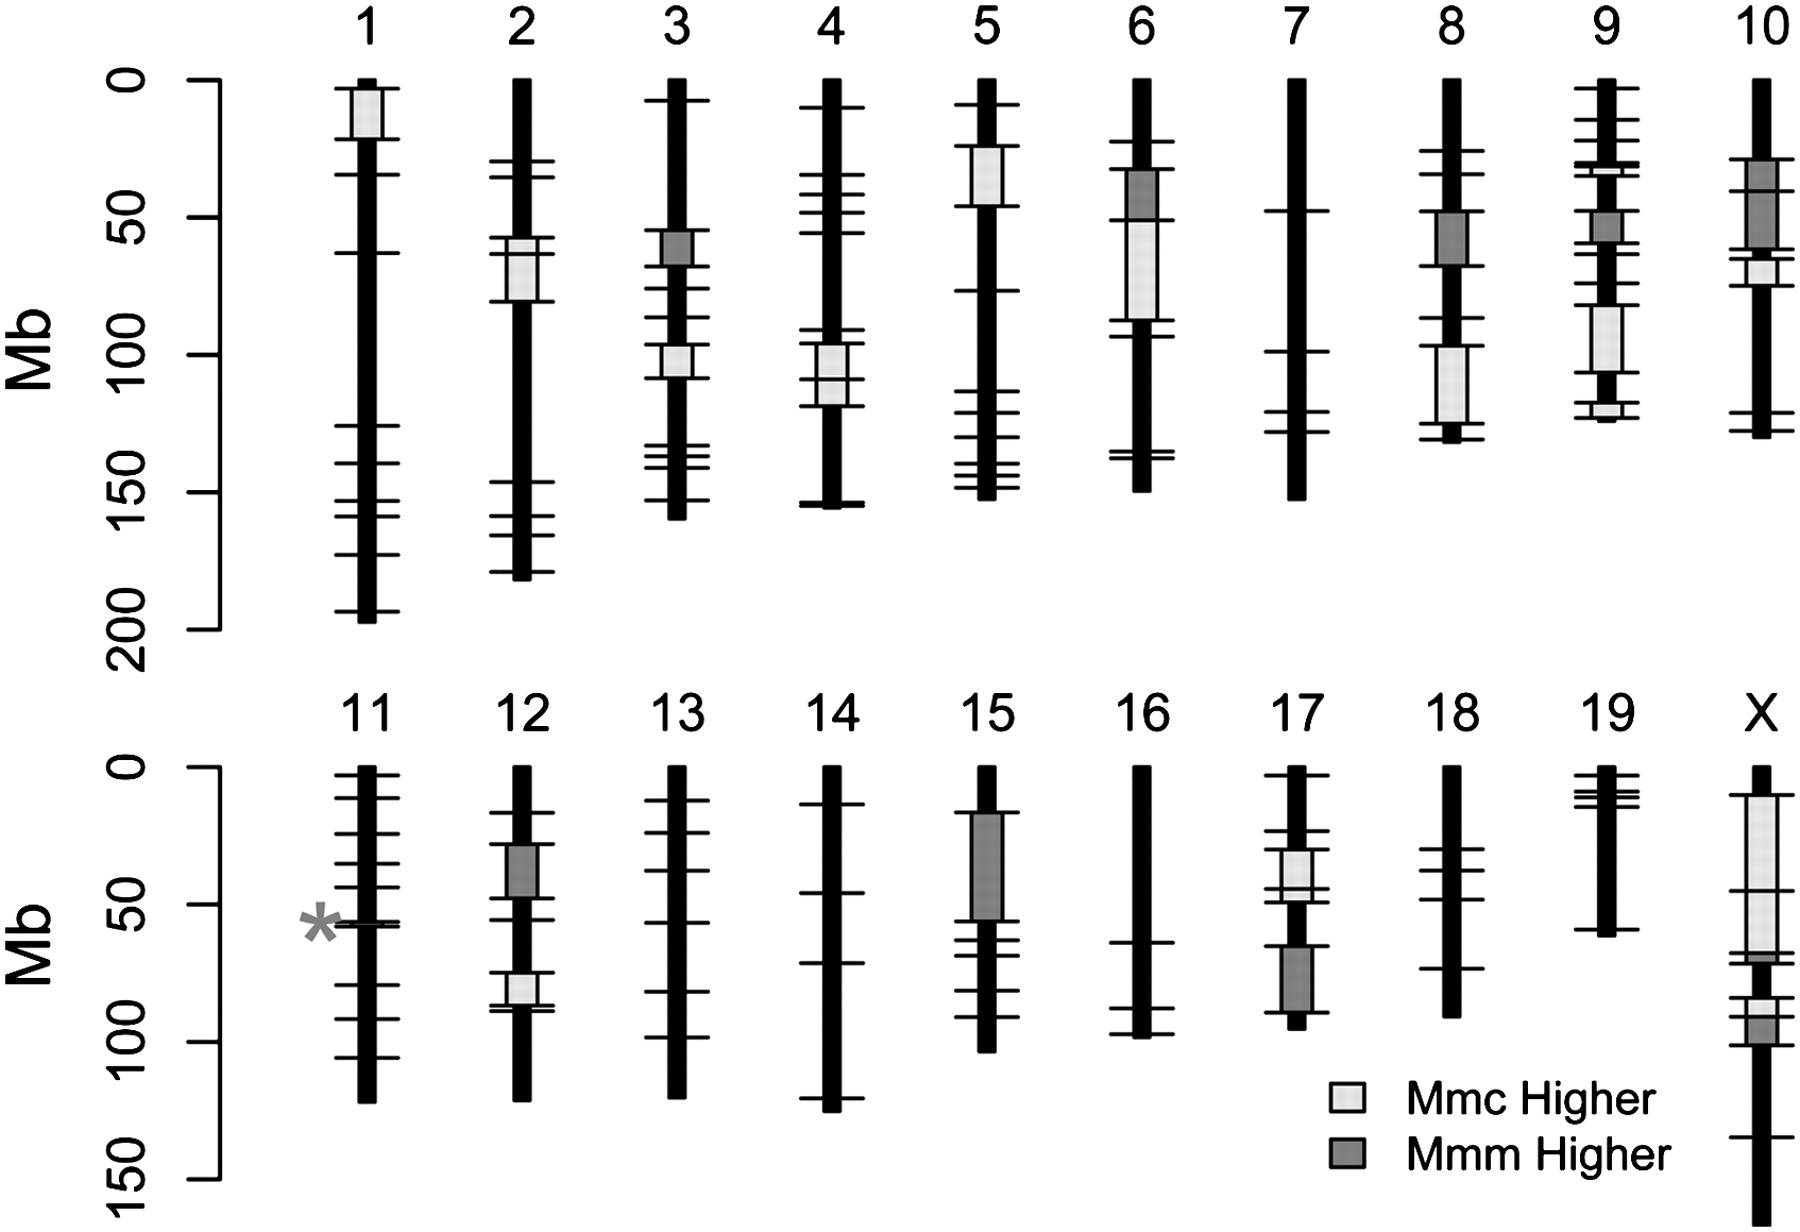
Figure 1.
Intervals with significant genetic map length differences between the Mmm cross and the Mmc cross are plotted on the physical mouse genome. (Black horizontal lines) The positions of loci typed in both crosses; (light gray boxes) regions with significantly longer map length in the Mmc cross relative to the cross with Mmm; (dark gray boxes) genomic intervals with significantly longer map lengths in the Mmm cross. The asterisk on chromosome 11 denotes a very small interval with a significantly longer map length in the Mmm cross.


